What You Should Do Before Interest Rates Rise

What You Should Do Before Interest Rates Rise | MyKCM

In today’s real estate market, mortgage interest rates are near record lows. If you’ve been in your current home for several years and haven’t refinanced lately, there’s a good chance you have a mortgage with an interest rate higher than today’s average. Here are some options you should consider if you want to take advantage of today’s current low rates before they rise.

Sell and Move Up (or Downsize)

Many of today’s homeowners are rethinking what they need in a home and redefining what their dream home means. For some, continued remote work is bringing about the need for additional space. For others, moving to a lower cost-of-living area or downsizing may be great options. If you’re considering either of these, there may not be a better time to move. Here’s why.

What You Should Do Before Interest Rates Rise | MyKCM

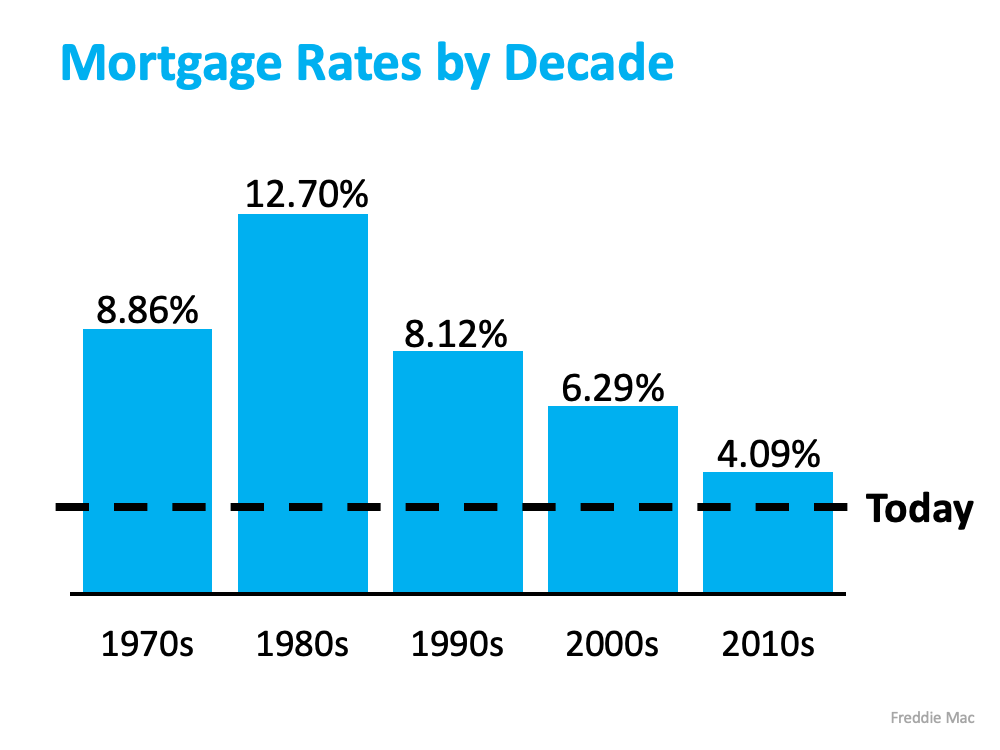
The chart below shows average mortgage rates by decade compared to where they are today:Today’s rates are below 3%, but experts forecast rates to rise over the next few years.

If the interest rate on your current mortgage is higher than today’s average, take advantage of this opportunity by making a move and securing a lower rate. Lower rates mean you may be able to get more house for your money and still have a lower monthly mortgage payment than you might expect.

What You Should Do Before Interest Rates Rise | MyKCM

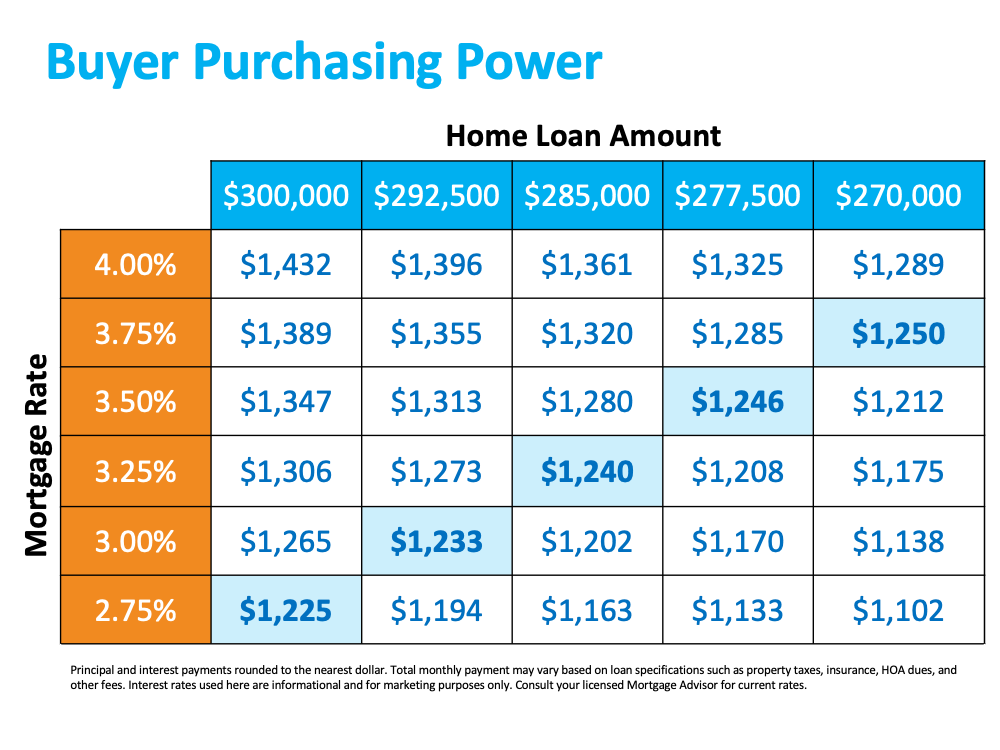
Waiting, however, might mean you miss out on this historic opportunity. Below is a chart showing how your monthly payment will change if you buy a home as mortgage rates increase:

Breaking It All Down:

Using the chart above, let’s look at the breakdown of a $300,000 mortgage:

  • When mortgage rates rise, so does the monthly payment you can secure.
  • Even the smallest increase in rates can make a difference in your monthly mortgage payment.
  • As interest rates rise, you’ll need to look at a lower-priced home to try and keep the same target monthly payment, meaning you may end up with less home for your money.

No matter what, whether you’re looking to make a move up or downsize to a home that better suits your needs, now is the time. Even a small change in interest rates can have a big impact on your purchasing power.

Refinance

If making a move right now still doesn’t feel right for you, consider refinancing. With the current low mortgage rates, refinancing is a great option if you’re looking to lower your monthly payments and stay in your current home.

Bottom Line

Take advantage of today’s low rates before they begin to rise. Whether you’re thinking about moving up, downsizing, or refinancing, let’s connect today to discuss which option is best for you.

How’s the Market?

July 20th
Portland Metro Area (OR and WA)
Market Activity for the Week of July 5th through July 11th 

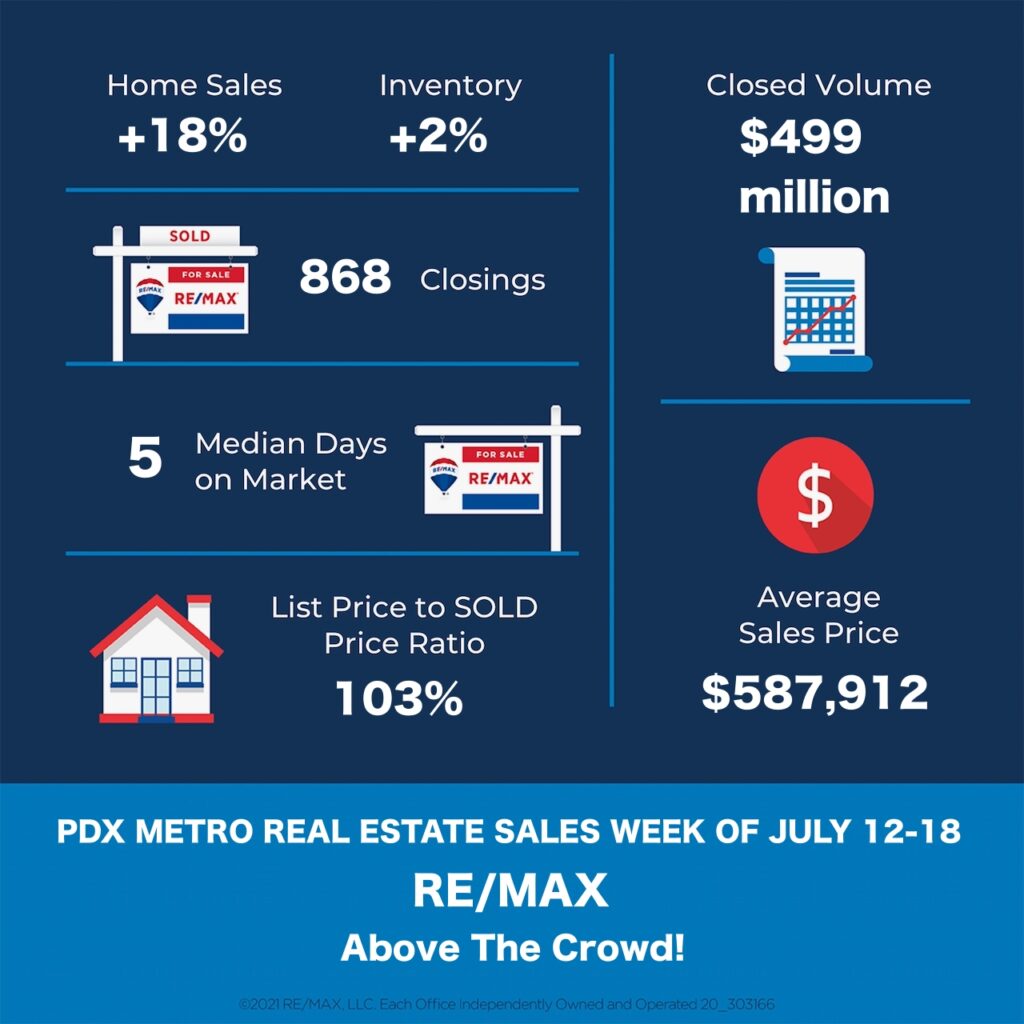
Homes Sold: 868 vs previous weeks: 732; 1035; 1035; 917; 802; 737; 685; 896; 792; 807; 749; 848; 684; 733; 687; 687; and 581. During the same week last year, this number was 974.

Active Listings: 3278 vs previous weeks: 3209; 3425; 3091; 2967; 2822; 2744; 2568; 2593; 2476; 2289; 2265; 2173; 2275 2252; 2163; 2135; and 1998. 

Total number of Pending Deals: 6256 vs previous weeks: 6250; 6186; 6586; 6593; 6664; 6546; 6587; 6640; 6561; 6501; 6388; 6393; 6216; 6049; 5894; 5835 and 5779.

New Pending Deals: 1101 vs previous weeks: 836; 934; 1030; 1050; 1068; 904; 1084; 1117; 1079; 998; 1037; 1088; 952; and 894. 

Average Days on Market: 16 (36 last year) – Median Days on Market 5 (10 last year).

Average Sale price: $587,912 vs $488,512 during the same week last year.

Total Sales Volume: $498,549,376 vs $475,810,688 during the same week last year.

Average List Price vs Sale Price
Average Sale Price as a Percentage of the Asking Price  – 103%
Median Sale Price as a Percentage of the Asking Price – 103.43%
Average Sale Price as a Percentage of the Original Asking Price – 102.41%

3 Charts That Show This Isn’t a Housing Bubble

3 Charts That Show This Isn’t a Housing Bubble | MyKCM

With home prices continuing to deliver double-digit increases, some are concerned we’re in a housing bubble like the one in 2006. However, a closer look at the market data indicates this is nothing like 2006 for three major reasons.

1. The housing market isn’t driven by risky mortgage loans.

3 Charts That Show This Isn’t a Housing Bubble | MyKCM

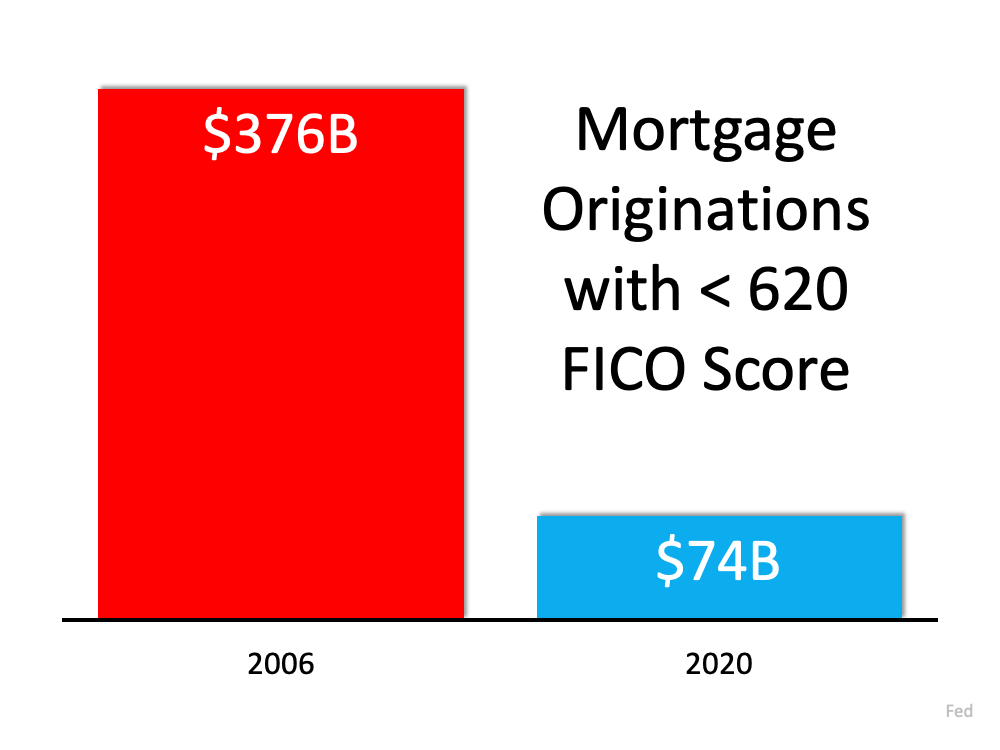
Back in 2006, nearly everyone could qualify for a loan. The Mortgage Credit Availability Index (MCAI) from the Mortgage Bankers’ Association is an indicator of the availability of mortgage money. The higher the index, the easier it is to obtain a mortgage. The MCAI more than doubled from 2004 (378) to 2006 (869). Today, the index stands at 130. As an example of the difference between today and 2006, let’s look at the volume of mortgages that originated when a buyer had less than a 620 credit score.Dr. Frank Nothaft, Chief Economist for CoreLogic, reiterates this point:

“There are marked differences in today’s run up in prices compared to 2005, which was a bubble fueled by risky loans and lenient underwriting. Today, loans with high-risk features are absent and mortgage underwriting is prudent.”

2. Homeowners aren’t using their homes as ATMs this time.

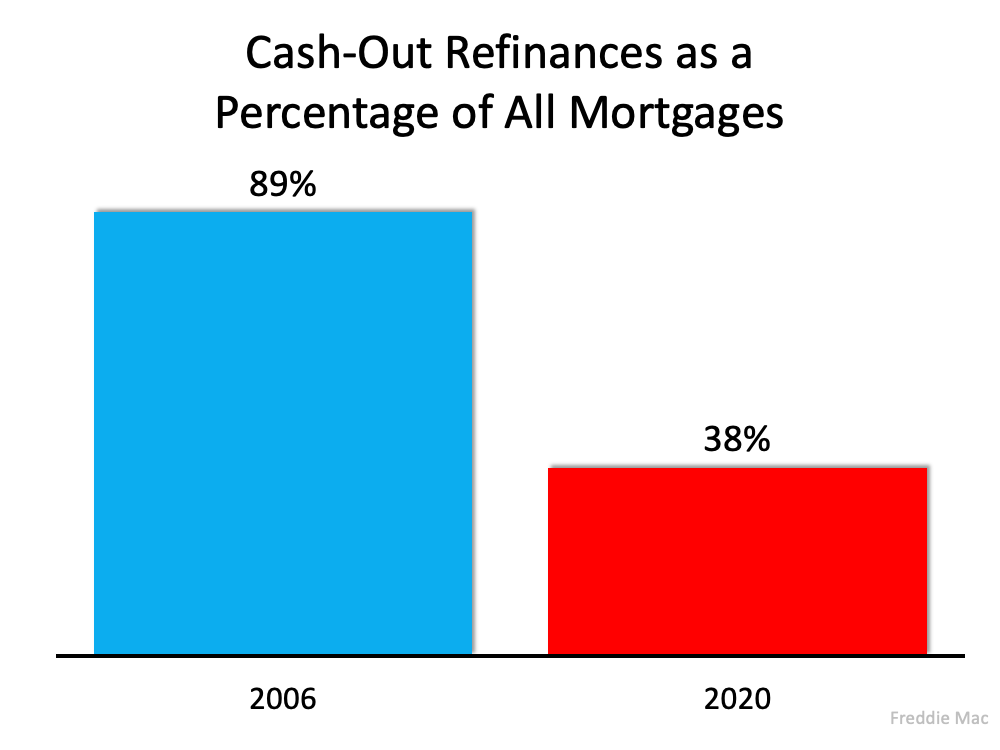
During the housing bubble, as prices skyrocketed, people were refinancing their homes and pulling out large sums of cash. As prices began to fall, that caused many to spiral into a negative equity situation (where their mortgage was higher than the value of the house).

Today, homeowners are letting their equity build. Tappable equity is the amount available for homeowners to access before hitting a maximum 80% combined loan-to-value ratio (thus still leaving them with at least 20% equity). In 2006, that number was $4.6 billion. Today, that number stands at over $8 billion.

3 Charts That Show This Isn’t a Housing Bubble | MyKCM

Yet, the percentage of cash-out refinances (where the homeowner takes out at least 5% more than their original mortgage amount) is half of what it was in 2006.

3. This time, it’s simply a matter of supply and demand.

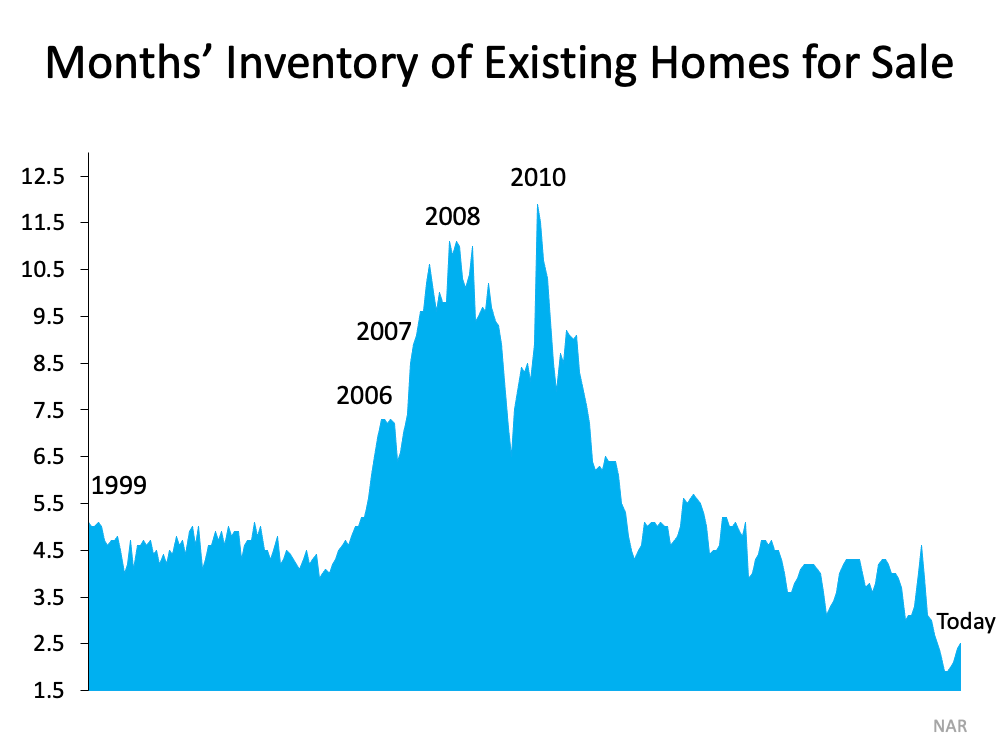
FOMO (the Fear Of Missing Out) dominated the housing market leading up to the 2006 housing bubble and drove up buyer demand. Back then, housing supply more than kept up as many homeowners put their houses on the market, as evidenced by the over seven months’ supply of existing housing inventory available for sale in 2006. Today, that number is barely two months.

Builders also overbuilt during the bubble but pulled back significantly over the next decade. Sam Khater, VP and Chief Economist, Economic & Housing Research at Freddie Macexplains that pullback is the major factor in the lack of available inventory today:

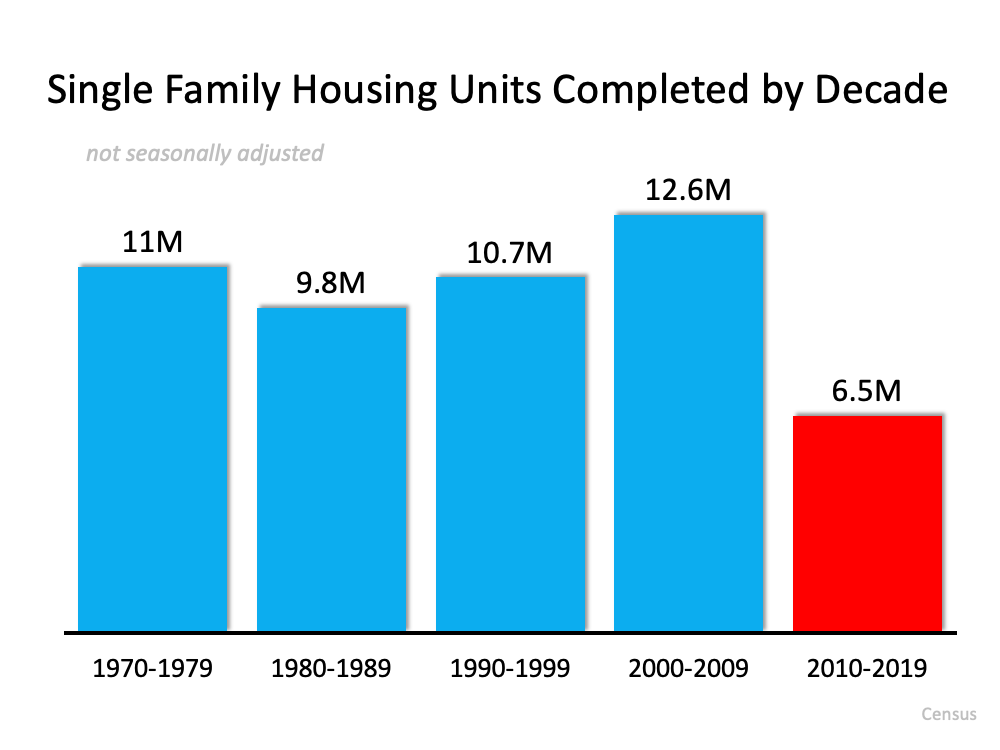
“The main driver of the housing shortfall has been the long-term decline in the construction of single-family homes.”

3 Charts That Show This Isn’t a Housing Bubble | MyKCM

Here’s a chart that quantifies Khater’s remarks:Today, there are simply not enough homes to keep up with current demand.

Bottom Line

This market is nothing like the run-up to 2006. Bill McBride, the author of the prestigious Calculated Risk blog, predicted the last housing bubble and crash. This is what he has to say about today’s housing market:

“It’s not clear at all to me that things are going to slow down significantly in the near future. In 2005, I had a strong sense that the hot market would turn and that, when it turned, things would get very ugly. Today, I don’t have that sense at all, because all of the fundamentals are there. Demand will be high for a while because Millennials need houses. Prices will keep rising for a while because inventory is so low.”

Experts Agree: Options Are Improving for Buyers [INFOGRAPHIC]

Experts Agree: Options Are Improving for Buyers [INFOGRAPHIC] | MyKCM

Some Highlights

  • Buyers hoping for more homes to choose from may be in luck as housing inventory begins to rise. Many experts agree – new sellers listing their homes is great news for buyers and the overall market.
  • Although the supply increases are modest, more homes means more options for buyers. A rise in inventory may also help slow the price gains we’ve seen recently and could be a sign of good things to come.
  • If you’re searching for a home, rising inventory is welcome news. Let’s connect today to discuss new listings in our area.

Diving Deep into Today’s Biggest Buyer Concerns

Diving Deep into Today’s Biggest Buyer Concerns | MyKCM

Last week, Fannie Mae released their Home Purchase Sentiment Index (HPSI). Though the survey showed 77% of respondents believe it’s a “good time to sell,” it also confirms what many are sensing: an increasing number of Americans believe it’s a “bad time to buy” a home. The percentage of those surveyed saying it’s a “bad time to buy” hit 64%, up from 56% last month and 38% last July.

The latest HPSI explains:

“Consumers also continued to cite high home prices as the predominant reason for their ongoing and significant divergence in sentiment toward homebuying and home-selling conditions. While all surveyed segments have expressed greater negativity toward homebuying over the last few months, renters who say they are planning to buy a home in the next few years have demonstrated an even steeper decline in homebuying sentiment than homeowners. It’s likely that affordability concerns are more greatly affecting those who aspire to be first-time homeowners than other consumer segments.”

Let’s look closely at the market conditions that impact home affordability.

A mortgage payment is determined by the price of the home and the mortgage rate on the loan used to purchase it. Lately, monthly mortgage payments have gone up for buyers for two key reasons:

  1. Mortgage rates have increased from 2.65% this past January to 2.9%.
  2. Home prices have increased by 15.4% over the last 12 months.

Based on these rising factors, a home may be less affordable today, but it doesn’t mean it’s not affordable.

Three weeks ago, ATTOM Data released their second-quarter 2021 U.S. Home Affordability Report which explained that the major ownership costs on the typical home as a percent of the average national wage had increased from 22.2% in the second quarter of 2020 to 25.2% in the second quarter of this year. They also went on to explain:

“Still, the latest level is within the 28 percent standard lenders prefer for how much homeowners should spend on mortgage payments, home insurance and property taxes.

In the same report, Todd Teta, Chief Product Officer with ATTOM, confirms:

Average workers across the country can still manage the major expenses of owning a home, based on lender standards.”

It’s true that monthly mortgage payments are greater than they were last year (as the ATTOM data shows), but they’re not unaffordable when compared to the last 30 years. While payments have increased dramatically during that several-decade span, if we adjust for inflation, today’s mortgage payments are 10.7% lower than they were in 1990.

What’s that mean for you? While you may not get the homebuying deal someone you know got last year, that doesn’t mean you shouldn’t still buy a home. Here are your alternatives to buying and the trade-offs you’ll have with each.

Alternative 1: I’ll rent instead.

Some may consider renting as the better option. However, the monthly cost of renting a home is skyrocketing. According to the July National Rent Report from Apartment List:

“…So far in 2021, rental prices have grown a staggering 9.2%. To put that in context, in previous years growth from January to June is usually just 2 to 3%. After this month’s spike, rents have been pushed well above our expectations of where they would have been had the pandemic not disrupted the market.”

If you continue to rent, chances are your rent will keep increasing at a fast pace. That means you could end up spending significantly more of your income on your rental as time goes on, which could make it even harder to save for a home.

Alternative 2: I’ll wait it out.

Others may consider waiting for another year and hoping that purchasing a home will be less expensive then. Let’s look at that possibility.

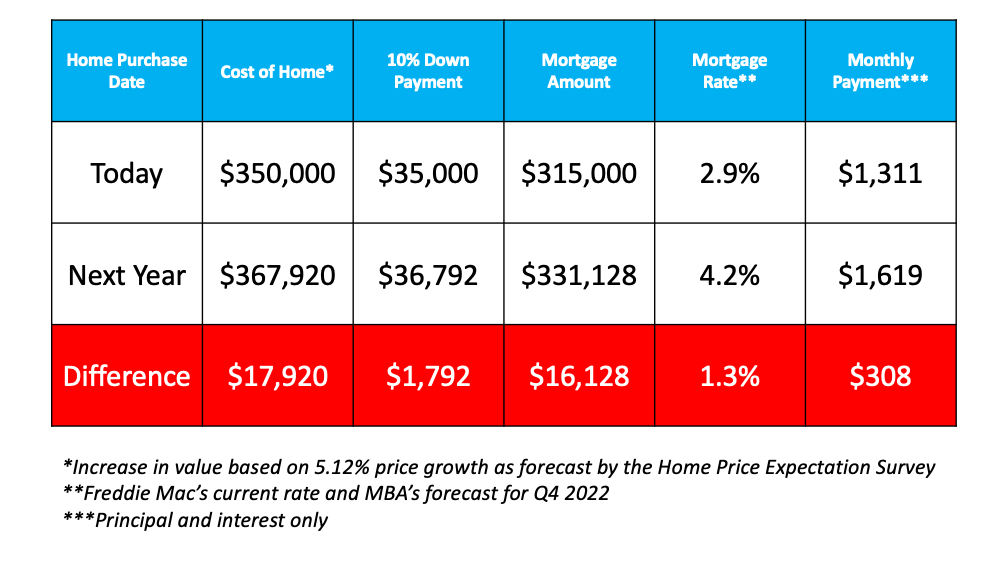
We’ve already established that a monthly mortgage payment is determined by the price of the home and the mortgage rate. A lower monthly payment would require one of those two elements to decrease over the next year. However, experts are forecasting the exact opposite:

  • The Mortgage Bankers Association (MBA) projects mortgage rates will be at 4.2% by the end of next year.
  • The Home Price Expectation Survey (HPES), a survey of over 100 economists, investment strategists, and housing market analysts, calls for home prices to increase by 5.12% in 2022.
Diving Deep into Today’s Biggest Buyer Concerns | MyKCM

Based on these projections, let’s see the possible impact on a monthly mortgage payment:By waiting until next year, you’d potentially pay more for the home, need a larger down payment, pay a higher mortgage rate, and pay an additional $3,696 each year over the life of the mortgage.

Bottom Line

While you may have missed the absolute best time to buy a home, waiting any longer may not make sense. Mark Fleming, Chief Economist at First Americansays it best:

“Affordability is likely to worsen before it improves, so try to buy it now, if you can find it.”

Housing Supply Is Rising. What Does That Mean for You?

Housing Supply Is Rising. What Does That Mean for You? | MyKCM

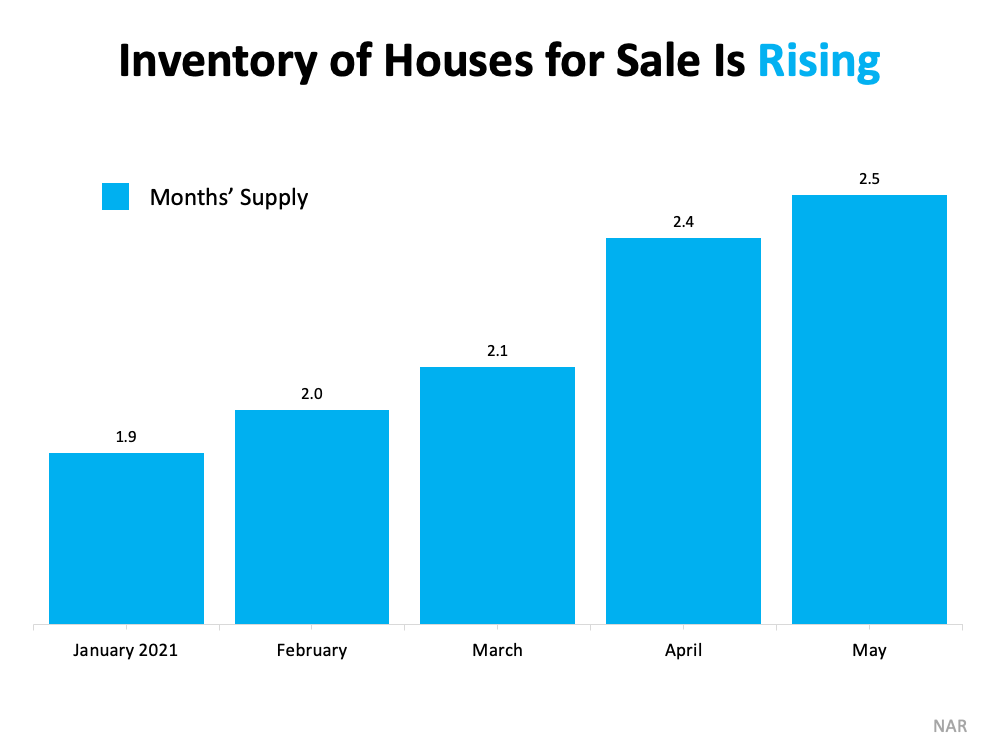
An important factor in today’s market is the number of homes for sale. While inventory levels continue to sit near historic lows, there are indications we may have hit the lowest point we’ll see. Odeta Kushi, Deputy Chief Economist at First American, recently said of our supply challenges:

It looks like inventory may have hit a bottom (we’ve seen this in the higher frequency data as well). Unsold inventory in May was at 2.5 months supply, up from 2.4.

Housing Supply Is Rising. What Does That Mean for You? | MyKCM

To put it into perspective, the graph below shows levels of inventory rising since the beginning of the year:We’re still not close to a balanced market, which would be a 6 months’ supply of homes for sale. However, we are seeing a slow but steady increase in homes coming up for sale. And that leaves many buyers and sellers wondering the same thing: what does that mean for me?

Buyers: More Options Are Arriving, so It’s Time To Act

If you’re a buyer, more inventory coming to market is a welcome sight. More supply means more options and less competition, which could mean fewer bidding wars.

According to the latest Monthly Housing Market Trends Report, supply levels are continuing to increase, which is different from the typical summer market:

“In June, newly listed homes grew by 5.5% on a year-over-year basis, and by 10.9% on a month-over-month basis. Typically, fewer newly listed homes appear on the market in the month of June compared to May. This year, growth in new listings is continuing later into the summer season, a welcome sign for a tight housing market.

If you’re having trouble finding your next home, this news should give you the hope and motivation to keep your buying process moving forward. Experts project mortgage rates will begin increasing, which will make purchasing a home less affordable as time passes. You can still capitalize on today’s low interest rates, so stick with your search as more homes come to market.

Sellers: Our Supply Challenges Aren’t Over Yet, so Now Is the Time To Sell

If you’ve been putting off selling your house, you shouldn’t wait much longer. The year’s month-over-month gains in homes for sale have helped buyers, but we’re still very much in a sellers’ market.

Housing Supply Is Rising. What Does That Mean for You? | MyKCM

As the graph below shows, even with the number of homes for sale rising, we’re still well below the supply levels we’ve seen historically:Of course, more homes are coming to market now, and more are expected in the coming months. Selling your house this summer gives you the chance to get ahead of the competition and maximize your sales potential before more homes are put up for sale in your neighborhood.

Bottom Line

More homes for sale means more options for buyers and more competition for sellers. Whether you’re looking to buy or sell, let’s connect today to discuss your options and why it’s still a good time to make your move.

Mortgage applications jump 16%

Increase corresponded with decline in rates last week

July 14, 2021, 7:00 am By Tim Glaze
Mortgage applications jump 16% – HousingWire

After several consecutive weeks of drops, mortgage applications jumped 16% for the week ending July 9, 2021, according to the latest report from the Mortgage Bankers Association.

The prior week‘s report showed a 1.8% drop in applications to the lowest level since January 2020.

The sudden increase in applications was driven “heavily” by increased refinancing as mortgage rates dipped again, said Joel Kan, MBA associate vice president of economic and industry forecasting.

“Treasury yields have trended lower over the past month as investors remained concerned about the COVID-19 variant and slowing economic growth,” Kan said. “There also may have been a delayed spillover of applications from the previous week, when rates also decreased but there was not much of response in terms of refinance applications.”

Those lower rates may be helping some homebuyers close on their purchases, especially first-time homebuyers, Kan said.

“We continue to see ebbs and flows as housing demand remains strong, but for-sale inventory remains low,” he said. “The year-over-year comparisons were down significantly for both purchase and refinance applications.”

The sheer amount of bidding wars decreased from May to June, per a study released this week from Redfin, as more homes for sale have slowly hit the market in the past month. Overall inventory is still low, of course, but a cooling of the market could lead to more would-be buyers and an increase in mortgage applications soon, experts said.

The refinance share of activity of total mortgage applications increased to 64.1% from 61.6% the previous week. On an unadjusted basis, the market composite index decreased 13% compared with the previous week. However, the seasonally adjusted purchase index increased 8% from one week earlier.

The FHA share of total mortgage applications decreased to 9.5% from 9.8% the week prior, and the VA share of total mortgage applications decreased to 10.3% from 10.8%.

Here is a more detailed breakdown of this week’s mortgage applications data:

  • The average contract interest rate for 30-year fixed-rate mortgages with conforming loan balances ($548,250 or less) decreased to 3.09% from 3.15%
  • The average contract interest rate for 30-year fixed-rate mortgages with jumbo loan balances (greater than $548,250) decreased to 3.16% from 3.20%
  • The average contract interest rate for 30-year fixed-rate mortgages decreased to 3.15% from 3.17%
  • The average contract interest rate for 15-year fixed-rate mortgages also decreased to 2.48% from 2.52%
  • The average contract interest rate for 5/1 ARMs increased to 3.02% from 2.94%, with points decreasing to 0.32 (including the origination fee) for 80% LTV loans

Market Activity for the Week of July 5th through July 11th

July 13th
Portland Metro Area (OR and WA)
Market Activity for the Week of July 5th through July 11th 

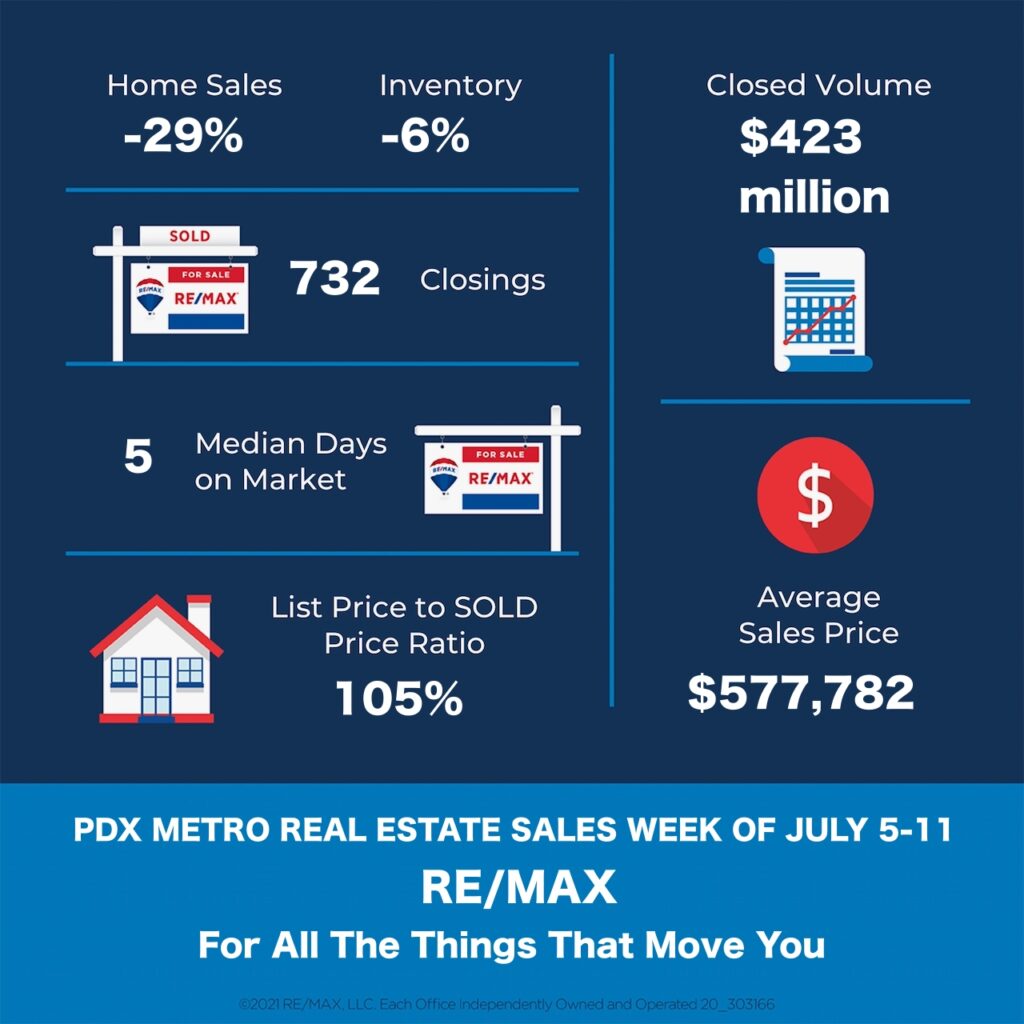
Homes Sold: 732 vs previous weeks: 1035; 1035; 917; 802; 737; 685; 896; 792; 807; 749; 848; 684; 733; 687; 687; and 581. During the same week last year, this number was 901.

Active Listings: 3209 vs previous weeks: 3425; 3091; 2967; 2822; 2744; 2568; 2593; 2476; 2289; 2265; 2173; 2275 2252; 2163; 2135; and 1998. 

Total number of Pending Deals: 6250 vs previous weeks: 6186; 6586; 6593; 6664; 6546; 6587; 6640; 6561; 6501; 6388; 6393; 6216; 6049; 5894; 5835 and 5779.

New Pending Deals: 836 vs previous weeks: 934; 1030; 1050; 1068; 904; 1084; 1117; 1079; 998; 1037; 1088; 952; and 894. 

Average Days on Market: 14 (36 last year) – Median Days on Market 5 (11 last year).

Average Sale price – $577,782 vs $507,859 during the same week last year.

Total Sales Volume – $422,936,424 vs $441,055,725 457,580,959 during the same week last year.

Average List Price vs Sale Price
Average Sale Price as a Percentage of the Asking Price  – 104.58%
Median Sale Price as a Percentage of the Asking Price – 105.05%
Average Sale Price as a Percentage of the Original Asking Price – 103.93%

Homebuyers are finally catching a break as new listings rise and mortgage rates drop

PUBLISHED MON, JUL 12 202110:36 AM EDTUPDATED MON, JUL 12 202110:54 AM EDT
Diana Olick
Homebuyers get a break as new listings rise and mortgage rates drop (cnbc.com)

  • New listings of homes jumped 4% in the four-week period ending July 4 from a year earlier, according to Redfin.
  • New listings were up 3% from the same time in 2019, the first time they topped pre-pandemic levels.
  • Seventy-seven percent of respondents said it’s a good time to sell, up from 67% in May, according to Fannie Mae.

For more than a year now, the housing market has been a perfect storm for sellers, but the winds may finally be shifting.

Strong demand and record-low supply are starting to ease, and mortgage rates are coming down off their recent highs. While home prices are still surging, these new market dynamics will likely take some of the heat out of those gains as well.

New listings of homes jumped 4% in the four week period ending July 4 compared with the same period one year ago, according to Redfin. They were up 3% from the same time in 2019. It was the first time new supply topped pre-pandemic levels.

The number of active listings is still down 32% from a year ago, but that’s actually the smallest annual drop since early February. Active listings are now up 8% from their 2021 low in early March.

“Many buyers have backed away from the housing market and are waiting until more and better homes are listed,” said Daryl Fairweather, Redfin’s chief economist. “Buyers don’t have the same sense of urgency that they did at the beginning of the year. They aren’t racing to buy before prices increase, because asking prices have already increased and stabilized.”

 A monthly housing sentiment survey in June from Fannie Mae found that 64% of respondents said it’s a bad time to buy a home, up from 56% in May. On selling, 77% of respondents said it’s a good time to sell, up from 67% in May.

Potential sellers had been holding properties off the market, not wanting people coming through their homes while the pandemic was raging. They were also concerned they wouldn’t be able to find something else to buy.

Vaccines, as well as rising inventory, are giving them more confidence, not to mention that they can now sell for top dollar. A record 55% of homes sold above listing price in June, up from 27% the year before.

Home prices were up 15.4% in May compared with May 2020, according to CoreLogic. Prices, however, are projected by CoreLogic economists to increase 3.4% by May 2022, as affordability challenges hit some buyers and cause a slowdown in price growth.

“First-time buyers are hitting a wall in many places around the country as the pace of home-price rises outpace the benefits of lower borrowing costs. Younger and first-time buyers, including younger millennials, are faced with the challenge of having sufficient savings for a down payment, closing costs and cash reserves,” said Frank Martell, president and CEO of CoreLogic.

Mortgage rates, while historically low, have been on a roller coaster lately, starting the year at a record low but then shooting higher at the end of March. Last week, they fell back again, and while they are expected to rise slowly over the long term, there appears to be no imminent fear of another spike.

“They [buyers] aren’t racing to buy before mortgage rates go up, because rates have dropped back below 3% and are likely to stay low. With more new listings starting to come on the market, buyers who threw in the towel may want to look again because the market is tilting more in their favor,” added Fairweather.

Consumers are also feeling better about the economy and their own personal wealth. That could inspire those buyers who do have the means to afford a new home but have so far chosen to remain renters.

“Despite the pessimism in homebuying conditions, we expect demand for housing to persist at an elevated level through the rest of the year,” said Doug Duncan, Fannie Mae’s chief economist.

“Mortgage rates remain not too far from their historical lows, and consumers are expressing even greater confidence about their household income and job situation compared to this time last year, when the pandemic had shut down wide swaths of the economy,” Duncan said.