
July 13th
Portland Metro Area (OR and WA)
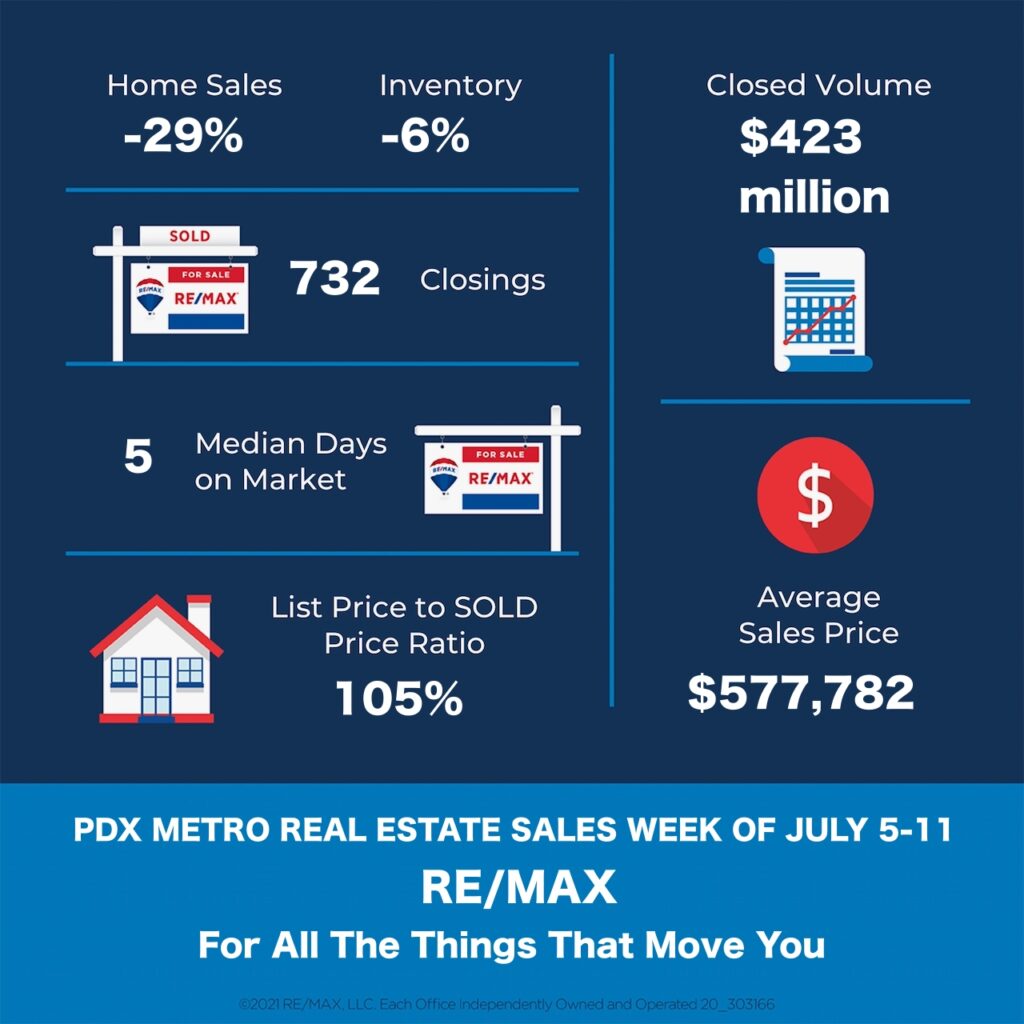
Market Activity for the Week of July 5th through July 11th
Homes Sold: 732 vs previous weeks: 1035; 1035; 917; 802; 737; 685; 896; 792; 807; 749; 848; 684; 733; 687; 687; and 581. During the same week last year, this number was 901.
Active Listings: 3209 vs previous weeks: 3425; 3091; 2967; 2822; 2744; 2568; 2593; 2476; 2289; 2265; 2173; 2275 2252; 2163; 2135; and 1998.
Total number of Pending Deals: 6250 vs previous weeks: 6186; 6586; 6593; 6664; 6546; 6587; 6640; 6561; 6501; 6388; 6393; 6216; 6049; 5894; 5835 and 5779.
New Pending Deals: 836 vs previous weeks: 934; 1030; 1050; 1068; 904; 1084; 1117; 1079; 998; 1037; 1088; 952; and 894.
Average Days on Market: 14 (36 last year) – Median Days on Market 5 (11 last year).
Average Sale price – $577,782 vs $507,859 during the same week last year.
Total Sales Volume – $422,936,424 vs $441,055,725 457,580,959 during the same week last year.
Average List Price vs Sale Price
Average Sale Price as a Percentage of the Asking Price – 104.58%
Median Sale Price as a Percentage of the Asking Price – 105.05%
Average Sale Price as a Percentage of the Original Asking Price – 103.93%