
July 20th
Portland Metro Area (OR and WA)
Market Activity for the Week of July 5th through July 11th
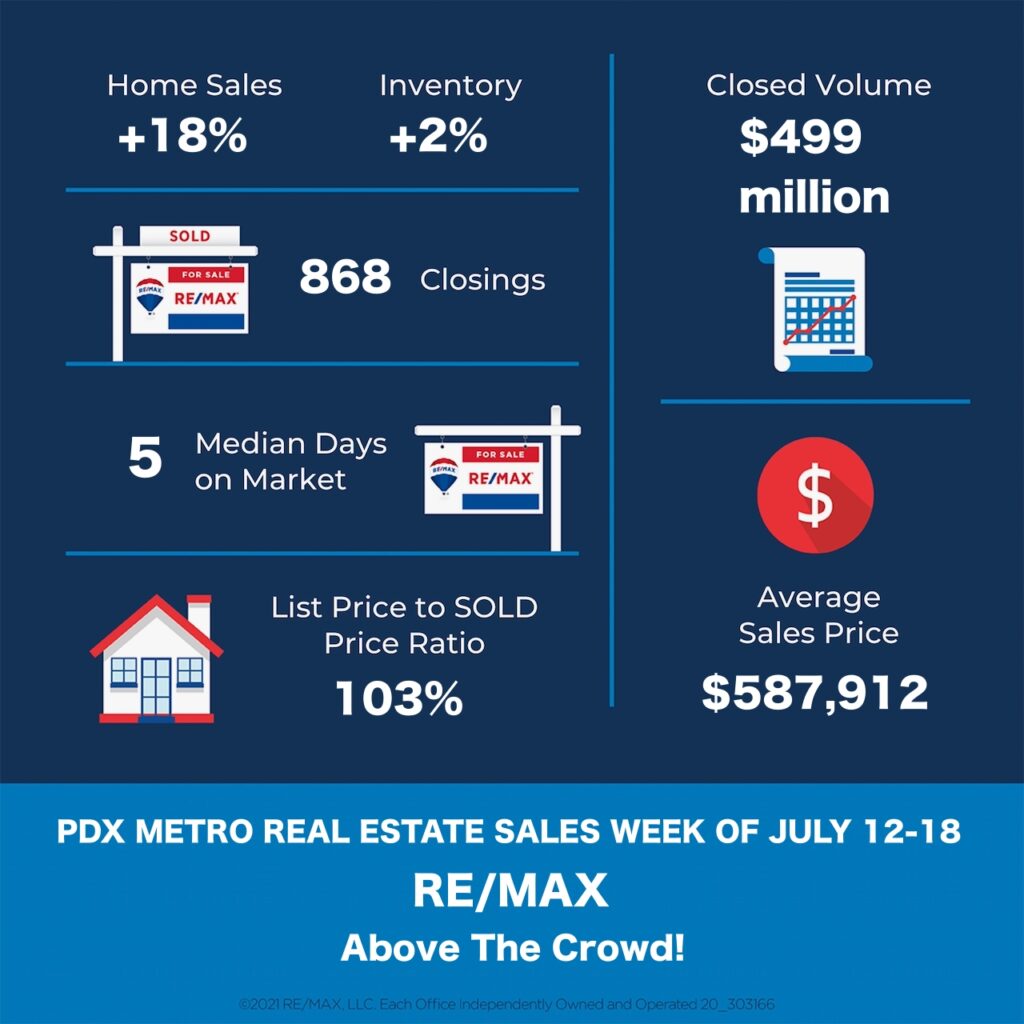
Homes Sold: 868 vs previous weeks: 732; 1035; 1035; 917; 802; 737; 685; 896; 792; 807; 749; 848; 684; 733; 687; 687; and 581. During the same week last year, this number was 974.
Active Listings: 3278 vs previous weeks: 3209; 3425; 3091; 2967; 2822; 2744; 2568; 2593; 2476; 2289; 2265; 2173; 2275 2252; 2163; 2135; and 1998.
Total number of Pending Deals: 6256 vs previous weeks: 6250; 6186; 6586; 6593; 6664; 6546; 6587; 6640; 6561; 6501; 6388; 6393; 6216; 6049; 5894; 5835 and 5779.
New Pending Deals: 1101 vs previous weeks: 836; 934; 1030; 1050; 1068; 904; 1084; 1117; 1079; 998; 1037; 1088; 952; and 894.
Average Days on Market: 16 (36 last year) – Median Days on Market 5 (10 last year).
Average Sale price: $587,912 vs $488,512 during the same week last year.
Total Sales Volume: $498,549,376 vs $475,810,688 during the same week last year.
Average List Price vs Sale Price
Average Sale Price as a Percentage of the Asking Price – 103%
Median Sale Price as a Percentage of the Asking Price – 103.43%
Average Sale Price as a Percentage of the Original Asking Price – 102.41%