VA Loans: Helping Veterans Achieve Their Homeownership Dreams

VA Loans: Helping Veterans Achieve Their Homeownership Dreams | MyKCM

The purpose of Veterans Affairs (VA) home loans is to provide a pathway to homeownership for those who have sacrificed so much by serving our nation. As the Veterans Administration says of the program:

“The objective of the VA Home Loan Guaranty program is to help eligible Veterans, active-duty personnel, surviving spouses, and members of the Reserves and National Guard purchase, retain, and adapt homes in recognition of their service. . . .”

For over 75 years, VA home loans have provided millions of veterans and their families the opportunity to purchase their own homes.

2020 Data on VA Home Loans

  • 1,246,817 home loans are guaranteed by the Veterans Administration
  • The average VA loan amount totals $301,044
  • 178,171 of those using a VA Loan are first-time homebuyers

Top Benefits of the VA Home Loan Program

As we reflect on their sacrifice and honor our nation’s veterans, it’s important to ensure all veterans know the full extent of benefits VA home loans offer. As Jeff London, Director of the VA Home Loan Programsays:

“VA loans offer an extraordinary opportunity for veterans because of lower interest rates, lower monthly payments, no or low-down payments, and no private mortgage insurance.”

Those who qualify for a VA home loan are eligible for the following:

  • Borrowers can often purchase a home with no down payment. In 2020, 350,094 individuals using a VA Loan were able to purchase their homes without putting money down.
  • Many other loans with down payments under 20% require Private Mortgage Insurance (PMI). VA Loans do not require PMI, which means veterans can save on their monthly housing costs.
  • Finally, VA-Backed Loans often offer the most competitive terms and interest rates.

Bottom Line

One way we can honor and thank our veterans this year is to ensure they have the best information about the benefits of VA home loans. Homeownership is the American Dream. Our veterans sacrifice so much in service to our nation and deserve to achieve their homeownership goals. Thank you for your service.

How Sellers Win When Housing Inventory Is Low

How Sellers Win When Housing Inventory Is Low | MyKCM

In today’s housing market, the number of homes for sale is much lower than the strong buyer demand. As a result, homeowners ready to sell have a significant advantage. Here are three ways today’s low inventory will set you up for a win when you sell this season.

1. Higher Prices

With so many more buyers in the market than homes available for sale, homebuyers are frequently getting into bidding wars for the houses they want to purchase. According to the latest data from the National Association of Realtors (NAR), homes are receiving an average of 3.7 offers in today’s market. This buyer competition drives home prices up. As a seller, this certainly works to your advantage, potentially netting you more for your house when you close the deal.

2. Greater Return on Your Investment

Rising prices mean homes are also gaining value, which increases the equity you have in your home. In the latest Homeowner Equity Insights ReportCoreLogic explains:

“In the second quarter of 2021, the average homeowner gained approximately $51,500 in equity during the past year.”

This year-over-year growth in equity gives you the ability to sell your house and then put that money toward a down payment on your next home, or to keep it as extra savings.

3. Better Terms

In a sellers’ market like we have today, you’re in the driver’s seat if you make a move. You have the power to sell on your terms, and buyers are more likely to work with you if it means they can finally land their dream home.

So, is low housing inventory a big deal?

Yes, especially if you want to sell on your terms. Moving now while inventory is so low is key to maximizing your opportunities.

Bottom Line

If you’re interested in taking advantage of the current sellers’ market, let’s connect today to determine your best move.

Two Graphs That Show Why You Shouldn’t Be Upset About 3% Mortgage Rates

Two Graphs That Show Why You Shouldn’t Be Upset About 3% Mortgage Rates | MyKCM

With the average 30-year fixed mortgage rate from Freddie Mac climbing above 3%, rising rates are one of the topics dominating the discussion in the housing market today. And since experts project rates will rise further in the coming months, that conversation isn’t going away any time soon.

But as a homebuyer, what do rates above 3% really mean?

Today’s Average Mortgage Rate Still Presents Buyers with a Great Opportunity

Two Graphs That Show Why You Shouldn’t Be Upset About 3% Mortgage Rates | MyKCM

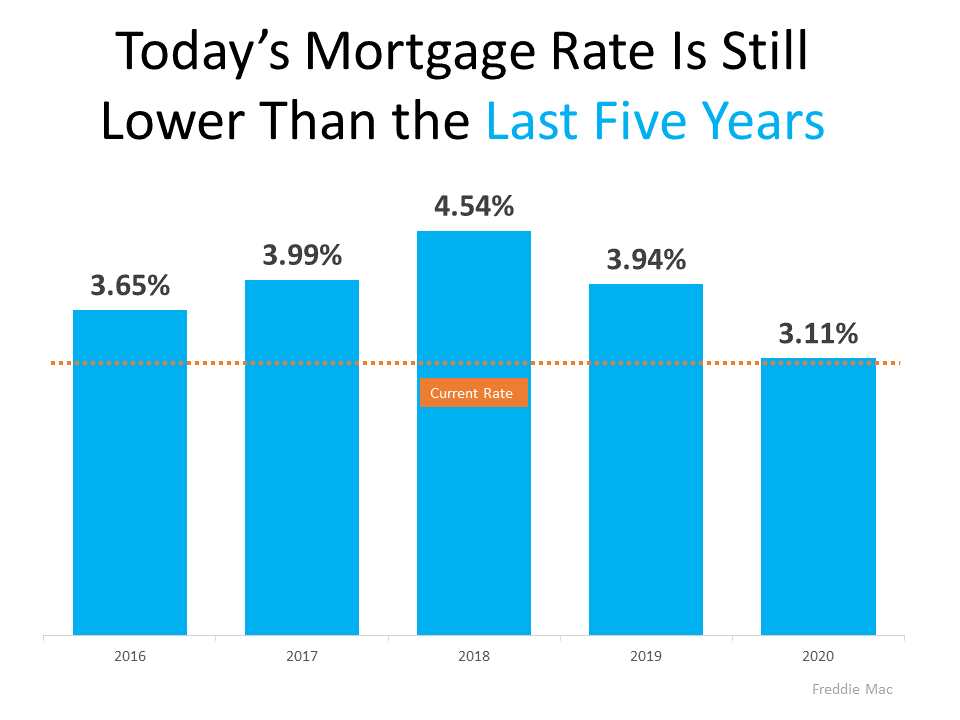
Buyers don’t want mortgage rates to rise, as any upward movement increases your monthly mortgage payment. But it’s important to put today’s average mortgage rate into perspective. The graph below shows today’s rate in comparison to average rates over the last five years:As the graph shows, even though today’s rate is above 3%, it’s still incredibly competitive.

Two Graphs That Show Why You Shouldn’t Be Upset About 3% Mortgage Rates | MyKCM

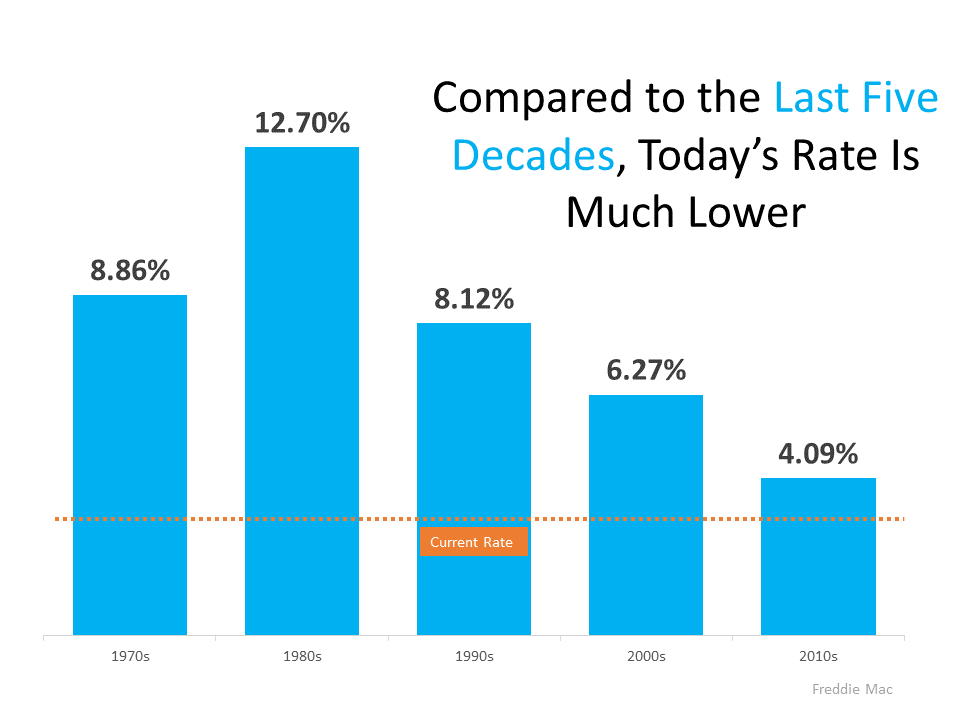
But today’s rate isn’t just low when compared to the most recent years. To truly put today into perspective, let’s look at the last 50 years (see graph below):When we look back even further, we can see that today’s rate is truly outstanding by comparison.

What Does That Mean for You?

Being upset that you missed out on sub-3% mortgage rates is understandable. But it’s important to realize, buying now still makes sense as experts project rates will continue to rise. And as rates rise, it will cost more to purchase a home.

As Mark Fleming, Chief Economist at First Americanexplains:

“Rising mortgage rates, all else equal, will diminish house-buying power, meaning it will cost more per month for a borrower to buy ‘their same home.’”

In other words, the longer you wait, the more it will cost you.

Bottom Line

While it’s true today’s average mortgage rate is higher than just a few months ago, 3% mortgage rates shouldn’t deter you from your homebuying goals. Historically, today’s rate is still low. And since rates are expected to continue rising, buying now could save you money in the long run. Let’s connect so you can lock in a great rate now.

Numbers Don’t Lie – It’s Still a Great Time To Sell [INFOGRAPHIC]

Numbers Don’t Lie – It’s Still a Great Time To Sell [INFOGRAPHIC] | MyKCM

Some Highlights

  • Heading into the end of the year, you might wonder if it’s still a good time to sell your house. Here’s what the latest data from the National Association of Realtors (NAR) says.
  • Housing supply is lower than last year, and home prices are up nationwide. Meanwhile, the average home is selling fast and receiving several offers. Listing now puts your house in the spotlight, meaning it could sell quickly – and for more than you’d expect.
  • Feeling motivated? If you’re ready to sell and capitalize on today’s market, let’s connect.

Mortgage rates decline to 3.09%

Rates dropped from 3.14% in the prior week, according to Freddie Mac’s PMMS

November 4, 2021, 10:00 am By Flávia Furlan Nunes

Mortgage rates decline to 3.09%

The average 30-year-fixed rate mortgage dropped to 3.09% during the week ending Nov. 4, down from 3.14% the week prior, according to the latest Freddie Mac PMMS Mortgage Survey. A year ago, the 30-year fixed-rate mortgage averaged 2.78%.

Most economists believe mortgage rates will climb following as the Federal Reserve tightens monetary policy. The central bank’s Federal Open Markets Committee announced on Wednesday that it will begin to taper its monthly asset purchases starting in November.

“While mortgage rates fell after several weeks on the rise, we expect future upticks due to stronger economic data and as the Federal Reserve pulls back on its stimulus,” Sam Khater, Freddie Mac’s chief economist, said in a statement.

Mortgage rates tend to move in concert with the 10-year Treasury yield, which reached 2% yesterday, after five weeks below the 2% level. The 15-year-fixed-rate mortgage averaged 2.35% last week, down from 2.37% the week prior. A year ago at this time, it averaged 2.32%.

The tapering will begin soon thanks to economic “substantial further progress,” according to the central bank. It will reduce the pace of its $120 billion in monthly purchases by $10 billion for Treasury securities and $5 billion for agency mortgage-backed securities.

“Progress on vaccinations and an easing of supply constraints are expected to support continued gains in economic activity and employment as well as a reduction in inflation,” the Fed said. “Risks to the economic outlook remain.”

Later this month, the Federal Reserve will purchase at least $70 billion Treasury securities and at least $35 billion agency mortgage-backed securities.   

Rising mortgage rates have already begun to sap demand. Mortgage application activity dropped 3.3% for the week ending Oct. 29, according to the most recent Mortgage Bankers Association (MBA) survey. The Refinance Index decreased 4% in one week, while the Purchase Index dropped 3% in the same period.

Joel Kan, MBA’s Associate Vice President of Economic and Industry Forecasting, said that mortgage rates decreased for the first time since August due to concerns about supply-chain bottlenecks, waning consumer confidence, weaker economic growth, and rising inflation.

Profit Margins on U.S. Home Sales Spike to Decade High in Q3

By David Barley | November 4, 2021 8:06 AM ET

https://www.worldpropertyjournal.com/real-estate-news/united-states/irvine/real-estate-news-to-attom-data-third-quarter-2021-us-home-sales-report-median-home-prices-in-2021-todd-teta-rising-home-price-data-12804.php

Median Home Prices Reach New Record High in North America

According to ATTOM Data’s newest quarterly U.S. Home Sales Report, profit margins on median-priced single-family home and condo sales across the United States jumped to 47.6 percent – the highest level since the end of the Great Recession a decade ago.

In yet another sign of how strong the U.S. housing market remains, the report reveals that the typical home sale across the country during the third quarter of 2021 generated a profit of $100,178 as the national median home price hit a record of $310,500. The latest profit level – also a new high – was up from $88,800 in the second quarter of 2021 and from $69,000 in the third quarter of 2020.

Those gains raised the typical return on investment that sellers made on their original purchase price nationwide from 42 percent in the second quarter of this year and 34.5 percent a year earlier. The investment-return increases marked the biggest quarterly jump since 2014 and the biggest annual surge since at least 2008.

Soaring profits in the third quarter came as the national median home price increased 3.5 percent from the second quarter of 2021 and 15.9 percent from the third quarter of 2020. The annual price surge marked the fifth straight quarter with year-over-year increases of at least 10 percent.

So hot was the national market in the third quarter that median home prices rose annually in 93 percent of U.S. metropolitan areas with enough data to analyze, while profit margins increased in 86 percent.

The latest price and profit improvements reflect a housing market that kept speeding ahead even as the U.S. economy only gradually recovered from widespread damage caused by the Coronavirus pandemic that hit early last year and continues to pose a threat. Amid rock-bottom interest rates and worries about living in congested virus-prone parts of the country, a glut of buyers has been chasing a tight supply of homes for sale over the past year and a half, raising demand and spiking prices.

“The third quarter of this year marked another period in a banner year for a housing market boom that’s steaming ahead through its 10th year. Prices and seller profits again hit new highs since the market started coming back from the Great Recession in 2012,” said Todd Teta, chief product officer at ATTOM. “There have been a couple of small hints of a possible slowdown in recent months, as we head into the normally quiet Fall and Winter seasons. The pandemic also remains a constant presence that could tamp things down. But, for now, the market engine seems to have nothing but high-octane gas in the tank.”

Profit margins rise annually in nearly 90 percent of metro areas around the U.S.

Typical profit margins – the percent change between median purchase and resale prices – rose from the third quarter of 2020 to the third quarter of 2021 in 175 (86 percent) of 204 metro areas around the United States with sufficient data to analyze. Margins also increased from the second to the third quarter of this year in 168 of the 204 metros (82 percent). Metro areas were included if they had at least 1,000 single-family home and condo sales in the third quarter of 2021 and a population of at least 200,000.

The biggest annual increases in profit margins came in the metro areas of Boise City, ID (margin up from 61.4 percent in the third quarter of 2020 to 130.3 percent in the third quarter of 2021); Claremont-Lebanon, NH (up from 41.1 percent to 93.8 percent); Augusta, GA (up from 19.6 percent to 56.6 percent); Raleigh, NC (up from 30.4 percent to 67 percent) and Bellingham, WA (up from 69.5 percent to 105.6 percent).

Aside from Raleigh, the biggest annual profit-margin increases in metro areas with a population of at least 1 million in the third quarter of 2021 were in Detroit, MI (margin up from 43 percent to 68 percent); Rochester, NY (up from 39.4 percent to 63.8 percent); Austin, TX (up from 47.6 percent to 70.9 percent) and Pittsburgh, PA (up from 40.1 percent to 61.9 percent).

Profit margins stayed the same or dropped, year over year, in just 29 of the 204 metro areas analyzed (14 percent) while they declined quarterly in 36 (18 percent). The biggest annual decreases were in Salem, OR (margin down from 75.6 percent in the third quarter of 2020 to 48.3 percent in the third quarter of 2021); Brownsville, TX (down from 37.1 percent to 13 percent); Kansas City, MO (down from 43.6 percent to 25.1 percent); San Jose, CA (down from 86.2 percent to 71 percent) and McAllen, TX (down from 33.4 percent to 19.9 percent).

Aside from Kansas City and San Jose, the largest annual drops in profit margins among metro areas with a population of at least 1 million came in Los Angeles, CA (down from 54.3 percent to 44.5 percent); Cleveland, OH (down from 32.8 percent to 25.7 percent) and Las Vegas, NV (down from 43.8 percent to 37.2 percent).

Largest profit margins again in West; smallest in South

The West continued to have the largest profit margins on typical home sales around the country, with eight of the top 10 returns on investment in the third quarter of 2021 from among the 204 metropolitan areas with enough data to analyze. They were led by Boise City, ID (130.3 percent return); Bellingham, WA (105.6 percent); Claremont-Lebanon, NH (93.8 percent); Spokane, WA (87.7 percent) and Prescott, AZ (84.7 percent).

Eleven of the 15 smallest margins were in the South region of the country. The lowest were in Shreveport, LA (2 percent); Gulfport, MS (7.4 percent); Columbus, GA (9.9 percent); Atlantic City, NJ (12.4 percent) and Brownsville, TX (13 percent).

Prices up at least 10 percent in two-thirds of nation

Median home prices in the third quarter of 2021 exceeded values from a year earlier by at least 10 percent in 136 (67 percent) of the 204 metropolitan statistical areas with enough data to analyze. Nationally, the median price of $310,500 in the third quarter was up from $300,000 in the second quarter of 2021 and $268,000 in the third quarter of last year.

The biggest year-over-year increases in median home prices during the third quarter of 2021 came in Worcester, MA (up 42.9 percent); Barnstable, MA (up 32.5 percent); Boston, MA (up 28.4 percent); Boise, ID (up 28.3 percent) and Lakeland, FL (up 27.8 percent).

Aside from Boston, the largest annual increases in metro areas with a population of at least 1 million in the third quarter of 2021 were in Austin, TX (up 26 percent); Phoenix, AZ (up 25.5 percent); Las Vegas, NV (up 22.8 percent) and Tucson, AZ (up 22.4 percent).

Home prices in the third quarter of 2021 hit or tied all-time highs in 84 percent of the metro areas in the report, including New York, NY; Los Angeles, CA; Chicago, IL; Dallas, TX, and Houston, TX.

The largest year-over-year decreases in median prices during the third quarter of 2021 were in Brownsville, TX (down 11.9 percent); Pittsburgh, PA (down 10.1 percent); Gulfport, MS (down 8.8 percent); Santa Maria, CA (down 7 percent) and Charleston, SC (down 4.9 percent).

Homeownership tenure remains at eight-year low

Homeowners who sold in the third quarter of 2021 had owned their homes an average of 6.31 years, virtually unchanged from 6.29 years in the second quarter of 2021 and down by more than a year from 7.85 years in the third quarter of 2020. The last two quarters marked the shortest times between purchase and resale since the first quarter of 2013.

Among 109 metro areas with sufficient data to analyze, tenure decreased from the third quarter 2020 to the same period this year in 101 (93 percent). They were led by Lakeland, FL (tenure down 74 percent); Tucson, AZ (down 53 percent); Madera, CA (down 44 percent); Springfield, MA (down 43 percent) and Memphis, TN (down 43 percent).

Fifteen of the 20 longest average tenures among sellers in the third quarter of 2021 were in the Northeast or West regions. They were led by Manchester, NH (10.09 years); Bellingham, WA (9.91 years); Lake Havasu City, AZ (9.69 years); Kahului-Wailuku-Lahaina, HI (9.21) and Rockford, IL (8.81 years).

The smallest average tenures among third-quarter sellers were in Lakeland, FL (1.97 years); Bremerton, WA (2.79 years); Portland, ME (3.39 years); Gulfport, MS (4.05 years) and Tucson, AZ (4.06 years).

Cash sales at six-year high

Nationwide, all-cash purchases accounted for 34 percent of all single-family house and condo sales in the third quarter of 2021, the highest level since the first quarter of 2015. The third-quarter 2021 number was up from 33.2 percent in the second quarter of 2021 and from 21.4 percent in the third quarter of last year.

Among metropolitan statistical areas with a population of at least 200,000 and sufficient cash-sales data, those where cash sales represented the largest share all transactions in the third quarter of 2021 were Columbus, GA (74.6 percent of all sales); Atlanta, GA (69 percent); Macon, GA (59.3 percent); Youngstown, OH (56.6 percent) and Detroit, MI (56.2 percent).

Those where cash sales represented the smallest share of all transactions in the third quarter of 2021 included Lincoln, NE (15.7 percent); Greeley, CO (17 percent); Salem, OR (17.1 percent) and Washington, DC (17.2 percent) and Worcester, MA (18.7 percent).

Institutional investment up to seven-year high

Institutional investors nationwide accounted for 7.3 percent of all single-family house and condo purchases in the third quarter of 2021, the highest level since the first quarter of 2014. The latest figure was up from 5 percent in the second quarter of 2021 and was up three-fold from 2.4 percent in the third quarter of last year.

Among states with enough data to analyze, those with the largest percentages of sales to institutional investors in the third quarter of 2021 were Arizona (17.4 percent of all sales), Georgia (13.9 percent), Mississippi (12.8 percent), Nevada (12.7 percent) and North Carolina (11.3 percent).

States with the smallest levels of sales to institutional investors in the third quarter of 2021 were Hawaii (1.7 percent of all sales), Maine (1.8 percent), Vermont (2.2 percent), New Hampshire (2.5 percent) and Rhode Island (2.5 percent).

FHA-financed purchases remain at nearly 14-year low

Nationwide, buyers using Federal Housing Administration (FHA) loans accounted for only 8.3 percent of all single-family home and condo purchases in the third quarter of 2021, the second-lowest level since the fourth quarter of 2007. The latest figure was up slightly from 8.1 percent in the previous quarter but down from 11.8 percent a year earlier.

Among metropolitan statistical areas with a population of at least 200,000 and sufficient FHA-buyer data, those with the highest levels of FHA buyers in the third quarter of 2021 were Lakeland, FL (21 percent of all sales); Mobile, AL (18.3 percent); Visalia, CA (17.7 percent); Bakersfield, CA (17.3 percent) and Yuma, AZ (16.9 percent).

Lender-owned foreclosures represent just 1 percent of all sales

Home sales following foreclosures by banks and other lenders represented just 1.1 percent of all sales in the third quarter of 2021. That was down from 1.3 percent in the second quarter of 2021 and from 2.9 percent in the third quarter of last year.

Metro areas where so-called REO sales represented the largest portions of all sales in the third quarter of 2021 with a population of 200K or more and with sufficient data to analyze were Macon, GA (4.6 percent of all sales); Lansing, MI (3.1 percent); St. Louis, MO (2.4 percent); South Bend, IN (2.3 percent) and Baltimore, MD (2.3 percent).