
August 17th
Portland Metro Area (OR and WA)
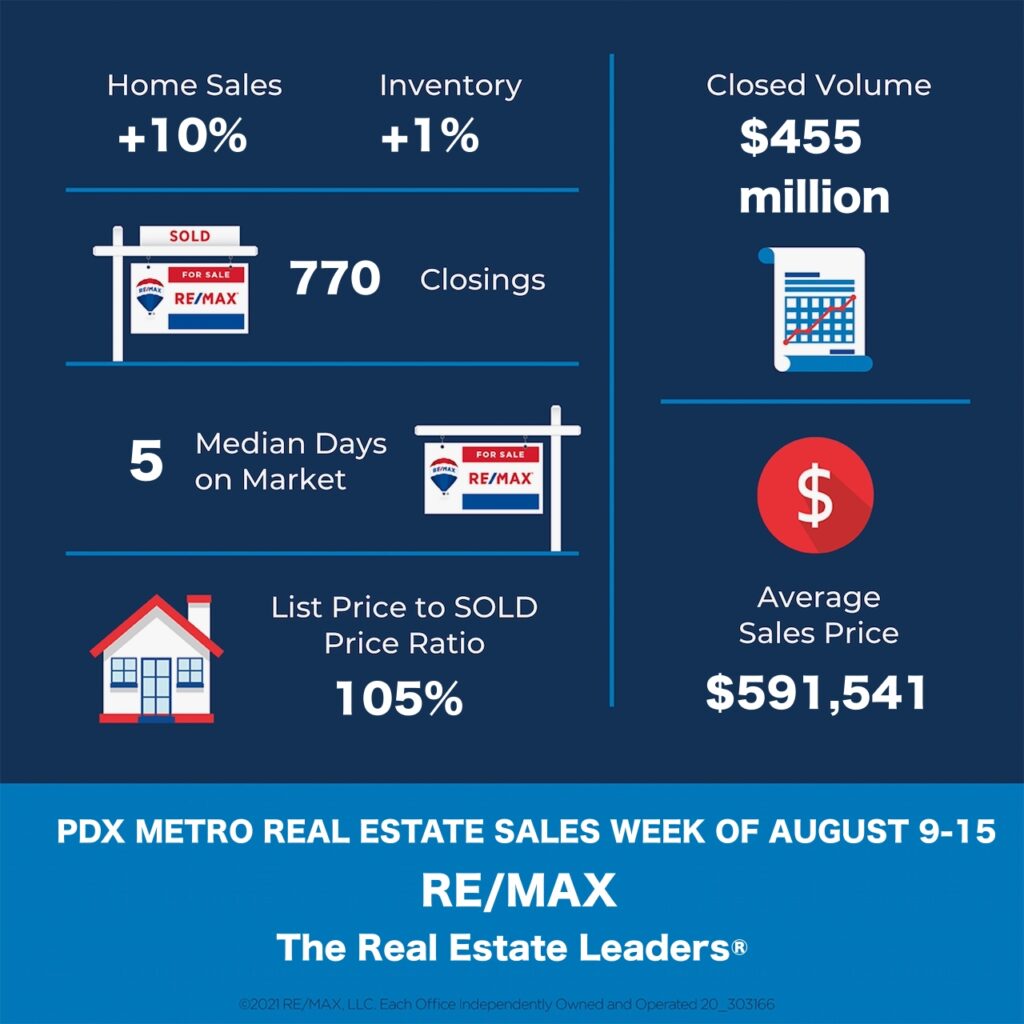
Market Activity for the Week of August 9th through August 15th
Homes Sold: 770 vs previous weeks: 698; 895; 793; 868; 732; 1035; 1035; 917; 802; 737; 685; 896; 792; 807; 749; 848; 684; 733; 687; 687; and 581. During the same week last year, this number was 897.
Active Listings: 3498 vs previous weeks: 3487; 3427; 3446; 3278; 3209; 3425; 3091; 2967; 2822; 2744; 2568; 2593; 2476; 2289; 2265; 2173; 2275 2252; 2163; 2135; and 1998.
Total number of Pending Deals: 6293 vs previous weeks: 6294; 6195; 6244; 6256; 6250; 6186; 6586; 6593; 6664; 6546; 6587; 6640; 6561; 6501; 6388; 6393; 6216; 6049; 5894; 5835 and 5779.
New Active Listings: 714
New Pending Deals: 1046 vs previous weeks: 1002; 1074; 1049; 1101; 836; 934; 1030; 1050; 1068; 904; 1084; 1117; 1079; 998; 1037; 1088; 952; and 894.
Average Days on Market 17 (31 last year)
Median Days on Market 5 (7 last year).
Average Sale price: $591,541 vs $526,794 during the same week last year.
Total Sales Volume: $455,486,570 vs $472,534,218 during the same week last year.