6 Simple Graphs Proving This Is Nothing Like Last Time
Last March, many involved in the residential housing industry feared the market would be crushed under the pressure of a once-in-a-lifetime pandemic. Instead, real estate had one of its best years ever. Home sales and prices were both up substantially over the year before. 2020 was so strong that many now fear the market’s exuberance mirrors that of the last housing boom and, as a result, we’re now headed for another crash.
However, there are many reasons this real estate market is nothing like 2008. Here are six visuals to show the dramatic differences.
1. Mortgage standards are nothing like they were back then.
During the housing bubble, it was difficult not to get a mortgage. Today, it’s tough to qualify. Recently, the Urban Institute released their latest Housing Credit Availability Index (HCAI) which “measures the percentage of owner-occupied home purchase loans that are likely to default—that is, go unpaid for more than 90 days past their due date. A lower HCAI indicates that lenders are unwilling to tolerate defaults and are imposing tighter lending standards, making it harder to get a loan. A higher HCAI indicates that lenders are willing to tolerate defaults and are taking more risks, making it easier to get a loan.”
The index shows that lenders were comfortable taking on high levels of risk during the housing boom of 2004-2006. It also reveals that today, the HCAI is under 5 percent, which is the lowest it’s been since the introduction of the index. The report explains:
“Significant space remains to safely expand the credit box. If the current default risk was doubled across all channels, risk would still be well within the pre-crisis standard of 12.5 percent from 2001 to 2003 for the whole mortgage market.”

This is nothing like the last time.
2. Prices aren’t soaring out of control.

Below is a graph showing annual home price appreciation over the past four years compared to the four years leading up to the height of the housing bubble. Though price appreciation was quite strong last year, it’s nowhere near the rise in prices that preceded the crash.There’s a stark difference between these two periods of time. Normal appreciation is 3.8%. So, while current appreciation is higher than the historic norm, it’s certainly not accelerating out of control as it did in the early 2000s.
This is nothing like the last time.
3. We don’t have a surplus of homes on the market. We have a shortage.

The months’ supply of inventory needed to sustain a normal real estate market is approximately six months. Anything more than that is an overabundance and will causes prices to depreciate. Anything less than that is a shortage and will lead to continued appreciation. As the next graph shows, there were too many homes for sale in 2007, and that caused prices to tumble. Today, there’s a shortage of inventory, which is causing an acceleration in home values.This is nothing like the last time.
4. New construction isn’t making up the difference in inventory needed.

Some may think new construction is filling the void. However, if we compare today to right before the housing crash, we can see that an overabundance of newly built homes was a major challenge then, but isn’t now.This is nothing like the last time.
5. Houses aren’t becoming too expensive to buy.

The affordability formula has three components: the price of the home, the wages earned by the purchaser, and the mortgage rate available at the time. Fifteen years ago, prices were high, wages were low, and mortgage rates were over 6%. Today, prices are still high. Wages, however, have increased, and the mortgage rate is about 3%. That means the average homeowner pays less of their monthly income toward their mortgage payment than they did back then. Here’s a chart showing that difference:As Mark Fleming, Chief Economist for First American, explains:
“Lower mortgage interest rates and rising incomes correspond with higher house prices as home buyers can afford to borrow and buy more. If housing is appropriately valued, house-buying power should equal or outpace the median sale price of a home. Looking back at the bubble years, house prices exceeded house-buying power in 2006, but today house-buying power is nearly twice as high as the median sale price nationally.”
This is nothing like the last time.
6. People are equity rich, not tapped out.

In the run-up to the housing bubble, homeowners were using their homes as personal ATM machines. Many immediately withdrew their equity once it built up, and they learned their lesson in the process. Prices have risen nicely over the last few years, leading to over 50% of homes in the country having greater than 50% equity – and owners have not been tapping into it like the last time. Here’s a table comparing the equity withdrawal over the last three years compared to 2005, 2006, and 2007. Homeowners have cashed out almost $500 billion dollars less than before:During the crash, home values began to fall, and sellers found themselves in a negative equity situation (where the amount of the mortgage they owed was greater than the value of their home). Some decided to walk away from their homes, and that led to a wave of distressed property listings (foreclosures and short sales), which sold at huge discounts, thus lowering the value of other homes in the area. With the average home equity now standing at over $190,000, this won’t happen today.
This is nothing like the last time.
Bottom Line
If you’re concerned that we’re making the same mistakes that led to the housing crash, take a look at the charts and graphs above to help alleviate your fears.
How Upset Should You Be about 3% Mortgage Rates?

Last Thursday, Freddie Mac announced that their 30-year fixed mortgage rate was over 3% (3.02%) for the first time since last July. That news dominated real estate headlines that day and the next. Articles talked about the “negative impact” it may have on the housing market. However, we should realize two things:
1. The bump-up in rate should not have surprised anyone. Many had already projected that rates would rise slightly as we proceeded through the year.
2. Freddie Mac’s comments about the rate increase were not alarming:
“The rise in mortgage rates over the next couple of months is likely to be more muted in comparison to the last few weeks, and we expect a strong spring sales season.”
A “muted” rise in rates will not sink the real estate market, and most experts agree that it will be “a strong spring sales season.”
What does this mean for you?
Obviously, any buyer would rather mortgage rates not rise at all, as any upward movement increases their monthly mortgage payment. However, let’s put a 3.02% rate into perspective. Here are the Freddie Mac annual mortgage rates for the last five years:
- 2016: 3.65%
- 2017: 3.99%
- 2018: 4.54%
- 2019: 3.94%
- 2020: 3.11%
Though 3.02% is not as great as the sub-3% rates we saw over the previous seven weeks, it’s still very close to the all-time low (2.66% in December 2020).
And, if we expand our look at mortgage rates to consider the last 50 years, we can see that today’s rate is truly outstanding. Here are the rates over the last five decades:
- 1970s: 8.86%
- 1980s: 12.7%
- 1990s: 8.12%
- 2000s: 6.29%
- 2010s: 4.09%
Being upset that you missed the “best mortgage rate ever” is understandable. However, don’t throw the baby out with the bathwater. Buying now still makes more sense than waiting, especially if rates continue to bump up this year.
Bottom Line
It’s true that you may not get the same rate you would have five weeks ago. However, you will get a better rate than what was possible at almost any other point in history. Let’s connect today so you can lock in a great rate while they stay this low.
Market Stats for 3/9
March 9th 2021
Week of March 1st through March 7th
Homes Sold: 611 – compared to 753 last week and 539 the week before. During the same week last year, this number was 617.
Active Listings: 2108 vs 1971 last week and 1980 the week before.
Total number of pending deals today – 5306 vs 5197 last week and 5188 the week before.
New Pending Deals: 941 up from 779 last week and 527 the previous week.
Average Days on Market 27 (47 last year) – Median Days on Market 5 (16 last year).
Average List Price vs Sale Price
Average Sale Price as a Percentage of the Asking Price – 102.49%
Median Sale Price as a Percentage of the Asking Price – 102.13%
Average Sale Price as a Percentage of the Original Asking Price 101.87%
Low Income Home Energy Score
Expanded access to income-qualified free Home Energy Scores
Did you know that free Home Energy Scores are available for home sellers that meet certain income requirements? The income qualifications were previously set at 60% of the Area Median Income (AMI). They are now being expanded to 80% of the AMI.
These thresholds, which vary according to household size, can be viewed by visiting the Portland Housing Bureau’s AMI calculator tool. For example, a family of four would qualify if their total household income was less than $65,000 and a single individual would qualify with $50,000 or less in total annual income.
Along with this expansion, home sellers should now contact Community Energy Project (CEP) directly for verification. Once qualified, CEP will also schedule and perform the free Home Energy Assessment. You no longer need to fill out the City of Portland’s online form.
Community Energy Project
Phone: (971) 544-8710
Email: hello@communityenergyproject.org
Direct Scheduling Link
You can also visit www.pdxhes.com at any time to find this contact information.If you work with clients in Portland and Milwaukie, the processes for getting an income-qualified free Home Energy Score are now exactly the same.
From EarthAdvantage.org
Thinking About Selling Your Home? Tackle These Kitchen Upgrades First
This Weekend: Choose what you’ll save for.
I found this great article about immediate gratification when it comes to savings. Give it a read.
By Shifrah Combiths
https://www.apartmenttherapy.com/weekend-projects-create-small-savings-goals-36866145

Apartment Therapy Weekend Projects is a guided program designed to help you get the happy, healthy home you’ve always wanted, one weekend at a time. Sign up now for email updates so you never miss a lesson.
As a mom to five kids, I spend a good deal of time considering behavior management strategies. While I do, of course, have to dole out consequences for bad choices, I’ve found, like all the experts say, that positive reinforcement really is the best way to create lasting behavior change.
When a good choice is met with a reward, your brain associates the good feeling with the action and the behavior is reinforced. Your brain, seeking the same feel-good result, encourages you to repeat the behavior that led to it. Eventually, choosing the desired behavior becomes a well-worn pathway.
The same psychological framework is true for adults, and you can use positive reinforcement to manage your own behavior. Knowing that you thrive on hits of the feel-good hormone dopamine gives you new power to stop bad habits and start new ones. Sometimes the only difference between failing at forming a new habit and it becoming part of who you are is just a matter of giving yourself a little reward each time you succeed in choosing it. What great news!
This weekend we’re going to apply the concept to a behavior that nearly everyone wishes to improve: how you spend money.
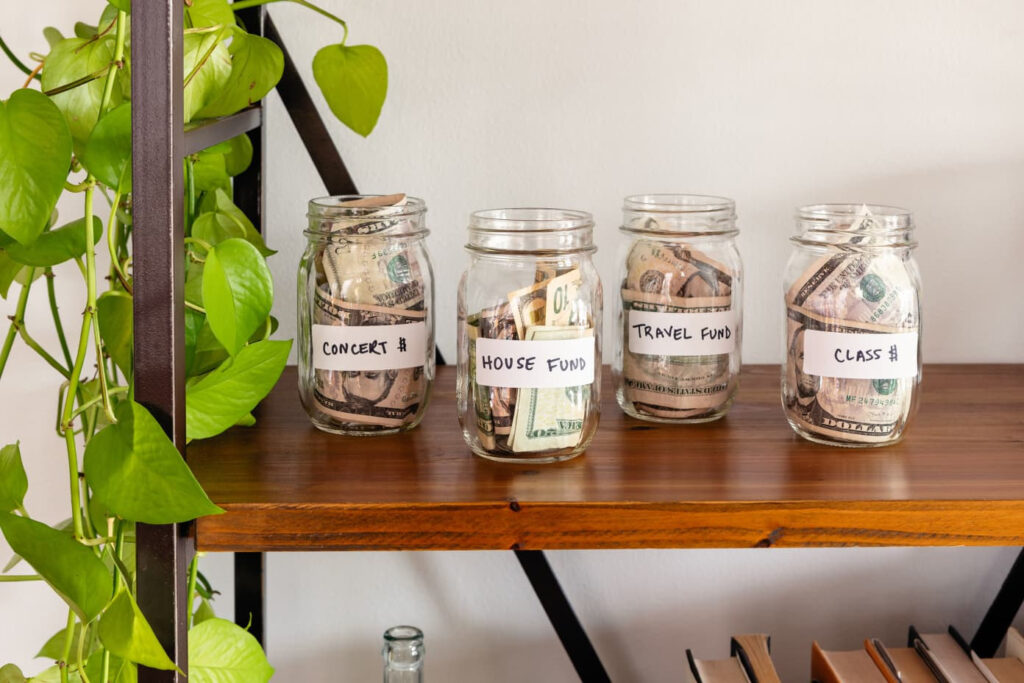
The idea here is to shift a money-saving mindset from a denial to an opportunity: thew opportunity to put that saved money toward something specific you’re excited about.
This weekend, choose categories or objects and create line items in your budget or even separate accounts for them. These could be things like a new couch, a vacation, a fancy scanner to deal with your physical papers once and for all (just me?), or even paying down a particular debt.
Each time you forego a treat at Starbucks, for example, put the money you saved immediately toward one of your goals. This way, saving money will feel like treating yourself, the savings will add up, and soon, not frivoling away your money will become a well-worn path in your brain and second-nature behavior. Happy saving!
Potential Sellers Kick off 2021 Feeling Optimistic
First-Time Home Buyers Find Unexpected Benefits in Current Market
It’s a Sellers’ Market [INFOGRAPHIC]
![It’s a Sellers’ Market [INFOGRAPHIC] | MyKCM](https://files.mykcm.com/2021/02/25131035/20210226-MEM-1046x1503.png)
Some Highlights
- Over the past year, homeowners have gained an unprecedented opportunity to sell with great success while buyer demand is soaring.
- With homes selling twice as fast as they did last year at this time, getting multiple offers, and rising in price, homeowners are in the driver’s seat.
- Let’s connect today if you’re ready to learn about the leverage you have as a seller in today’s housing market.