The Most Common Misconceptions Around Building Credit Potential Homebuyers Need to Know
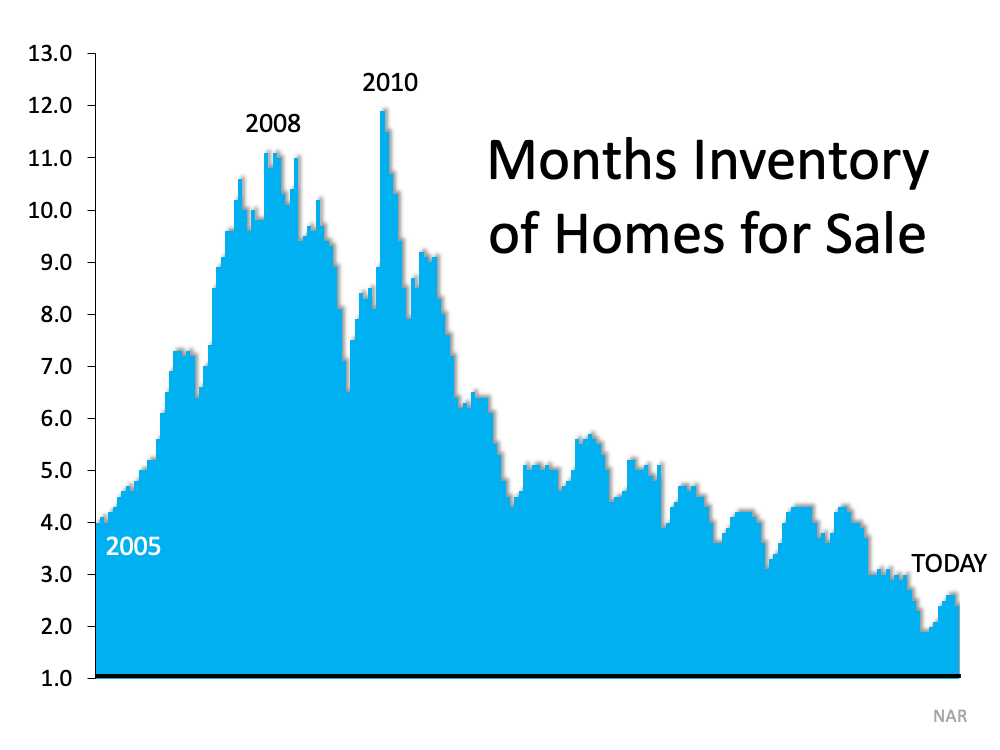
How Sellers Win When Housing Inventory Is Low

In today’s housing market, the number of homes for sale is much lower than the strong buyer demand. As a result, homeowners ready to sell have a significant advantage. Here are three ways today’s low inventory will set you up for a win when you sell this season.
1. Higher Prices
With so many more buyers in the market than homes available for sale, homebuyers are frequently getting into bidding wars for the houses they want to purchase. According to the latest data from the National Association of Realtors (NAR), homes are receiving an average of 3.7 offers in today’s market. This buyer competition drives home prices up. As a seller, this certainly works to your advantage, potentially netting you more for your house when you close the deal.
2. Greater Return on Your Investment
Rising prices mean homes are also gaining value, which increases the equity you have in your home. In the latest Homeowner Equity Insights Report, CoreLogic explains:
“In the second quarter of 2021, the average homeowner gained approximately $51,500 in equity during the past year.”
This year-over-year growth in equity gives you the ability to sell your house and then put that money toward a down payment on your next home, or to keep it as extra savings.
3. Better Terms
In a sellers’ market like we have today, you’re in the driver’s seat if you make a move. You have the power to sell on your terms, and buyers are more likely to work with you if it means they can finally land their dream home.
So, is low housing inventory a big deal?
Yes, especially if you want to sell on your terms. Moving now while inventory is so low is key to maximizing your opportunities.
Bottom Line
If you’re interested in taking advantage of the current sellers’ market, let’s connect today to determine your best move.
Two Graphs That Show Why You Shouldn’t Be Upset About 3% Mortgage Rates

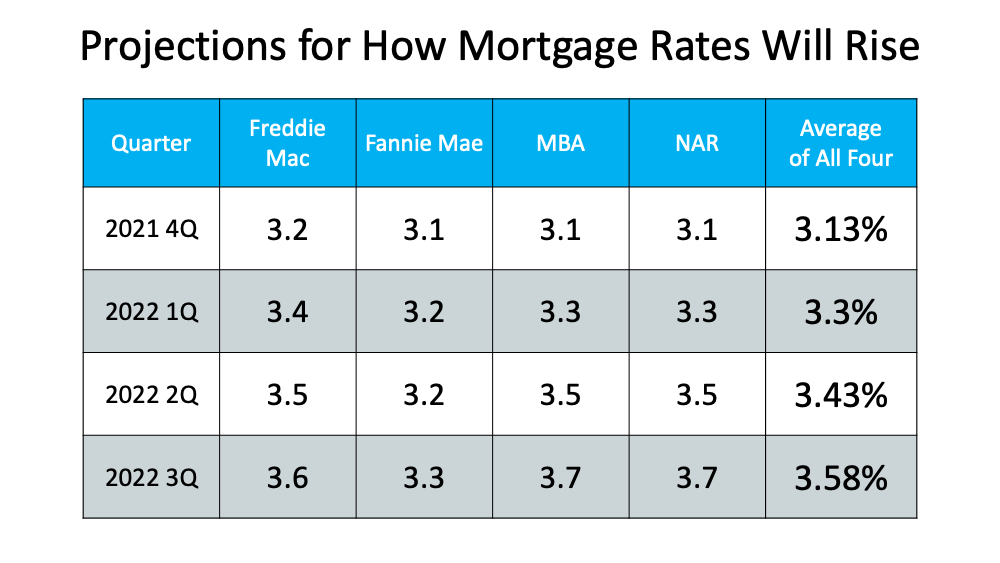
With the average 30-year fixed mortgage rate from Freddie Mac climbing above 3%, rising rates are one of the topics dominating the discussion in the housing market today. And since experts project rates will rise further in the coming months, that conversation isn’t going away any time soon.
But as a homebuyer, what do rates above 3% really mean?
Today’s Average Mortgage Rate Still Presents Buyers with a Great Opportunity
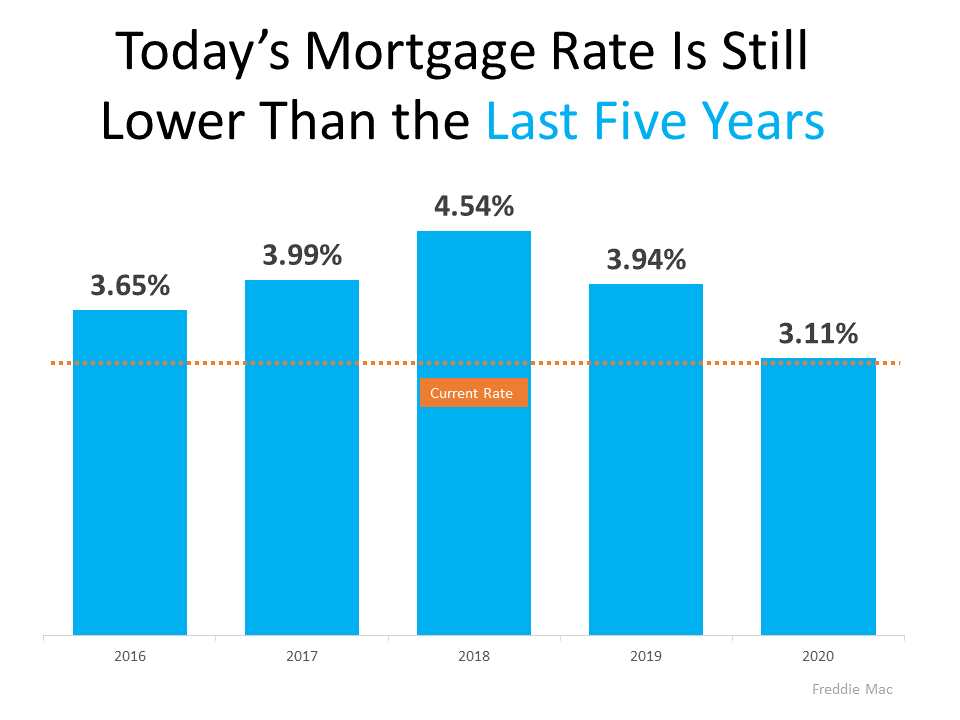
Buyers don’t want mortgage rates to rise, as any upward movement increases your monthly mortgage payment. But it’s important to put today’s average mortgage rate into perspective. The graph below shows today’s rate in comparison to average rates over the last five years:As the graph shows, even though today’s rate is above 3%, it’s still incredibly competitive.
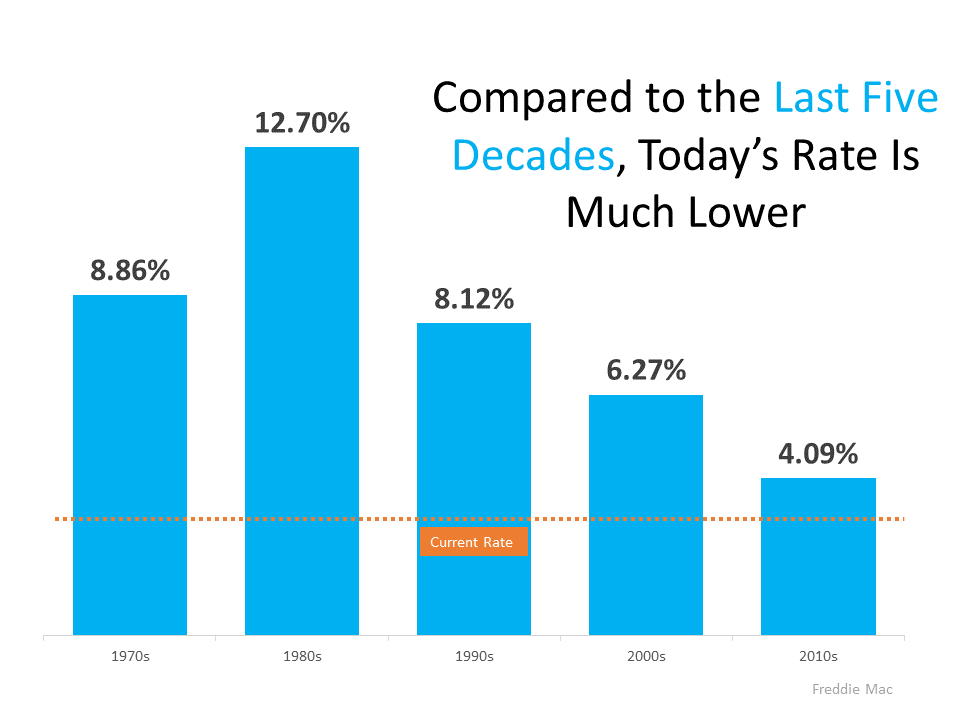
But today’s rate isn’t just low when compared to the most recent years. To truly put today into perspective, let’s look at the last 50 years (see graph below):When we look back even further, we can see that today’s rate is truly outstanding by comparison.
What Does That Mean for You?
Being upset that you missed out on sub-3% mortgage rates is understandable. But it’s important to realize, buying now still makes sense as experts project rates will continue to rise. And as rates rise, it will cost more to purchase a home.
As Mark Fleming, Chief Economist at First American, explains:
“Rising mortgage rates, all else equal, will diminish house-buying power, meaning it will cost more per month for a borrower to buy ‘their same home.’”
In other words, the longer you wait, the more it will cost you.
Bottom Line
While it’s true today’s average mortgage rate is higher than just a few months ago, 3% mortgage rates shouldn’t deter you from your homebuying goals. Historically, today’s rate is still low. And since rates are expected to continue rising, buying now could save you money in the long run. Let’s connect so you can lock in a great rate now.
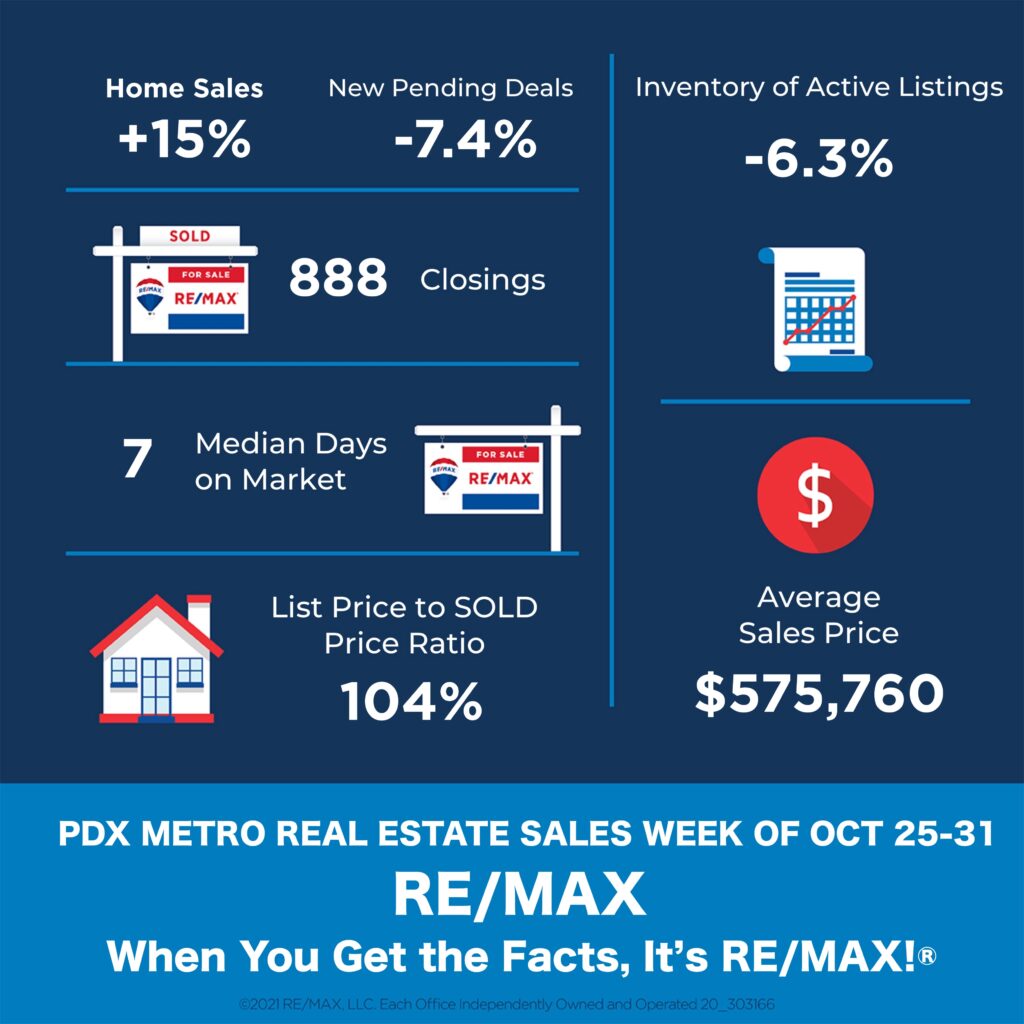
Numbers Don’t Lie – It’s Still a Great Time To Sell [INFOGRAPHIC]
![Numbers Don’t Lie – It’s Still a Great Time To Sell [INFOGRAPHIC] | MyKCM](https://files.mykcm.com/2021/11/04145531/20211105-MEM-1046x2041.png)
Some Highlights
- Heading into the end of the year, you might wonder if it’s still a good time to sell your house. Here’s what the latest data from the National Association of Realtors (NAR) says.
- Housing supply is lower than last year, and home prices are up nationwide. Meanwhile, the average home is selling fast and receiving several offers. Listing now puts your house in the spotlight, meaning it could sell quickly – and for more than you’d expect.
- Feeling motivated? If you’re ready to sell and capitalize on today’s market, let’s connect.
Mortgage rates decline to 3.09%
Rates dropped from 3.14% in the prior week, according to Freddie Mac’s PMMS
November 4, 2021, 10:00 am By Flávia Furlan Nunes
Mortgage rates decline to 3.09%
The average 30-year-fixed rate mortgage dropped to 3.09% during the week ending Nov. 4, down from 3.14% the week prior, according to the latest Freddie Mac PMMS Mortgage Survey. A year ago, the 30-year fixed-rate mortgage averaged 2.78%.
Most economists believe mortgage rates will climb following as the Federal Reserve tightens monetary policy. The central bank’s Federal Open Markets Committee announced on Wednesday that it will begin to taper its monthly asset purchases starting in November.
“While mortgage rates fell after several weeks on the rise, we expect future upticks due to stronger economic data and as the Federal Reserve pulls back on its stimulus,” Sam Khater, Freddie Mac’s chief economist, said in a statement.
Mortgage rates tend to move in concert with the 10-year Treasury yield, which reached 2% yesterday, after five weeks below the 2% level. The 15-year-fixed-rate mortgage averaged 2.35% last week, down from 2.37% the week prior. A year ago at this time, it averaged 2.32%.
The tapering will begin soon thanks to economic “substantial further progress,” according to the central bank. It will reduce the pace of its $120 billion in monthly purchases by $10 billion for Treasury securities and $5 billion for agency mortgage-backed securities.
“Progress on vaccinations and an easing of supply constraints are expected to support continued gains in economic activity and employment as well as a reduction in inflation,” the Fed said. “Risks to the economic outlook remain.”
Later this month, the Federal Reserve will purchase at least $70 billion Treasury securities and at least $35 billion agency mortgage-backed securities.
Rising mortgage rates have already begun to sap demand. Mortgage application activity dropped 3.3% for the week ending Oct. 29, according to the most recent Mortgage Bankers Association (MBA) survey. The Refinance Index decreased 4% in one week, while the Purchase Index dropped 3% in the same period.
Joel Kan, MBA’s Associate Vice President of Economic and Industry Forecasting, said that mortgage rates decreased for the first time since August due to concerns about supply-chain bottlenecks, waning consumer confidence, weaker economic growth, and rising inflation.