10 statistics about Oregon’s real estate market

By StackerPublished  12:21 PM

10 statistics about Oregon’s real estate market

The economy of real estate is both simple and complex. Like with any other commodity, supply and demand determine cost within the housing market, and right now, home costs are at a record high—an increase of 18% since September 2020. But the factors creating record-low inventory and a surge in buying interest are varied and complicated.

To illustrate just how skewed the market is, we can look at the months of supply metric. This measure tells us how many months it would take for all homes on the market to sell at the current rate. In a balanced real estate market, that number is six. Since 2019, the average months of supply have dipped from about four to fewer than two. The number of single-family homes for sale in the U.S. at the beginning of 2021 was just 870,000, the lowest in roughly 40 years, according to a 2021 study by Harvard University.

Investment firms have found themselves on the favorable side of the pandemic housing crisis, accounting for owning one of out every six homes, and 25% of all apartments purchased in quarter two of 2021. Investors have been able to take advantage of the low interest rates and the demand for rentals, particularly among those who are priced out of the market.

While the pandemic has played a significant role in driving demand for housing, it is only partially to blame for the supply shortage. That problem—which is actually an underproduction problem—began two decades before the world had ever heard of COVID-19.

According to the National Association of Realtors (NAR), the U.S. built 276,000 fewer homes per year, on average, between 2001 and 2020, compared to the 30 years prior. Had the pace of production not dropped over the last 20 years, there would be 5.5 million more homes in existence. The NAR estimates the U.S. would need to construct more than 2 million new units per year over the next decade to close the gap. Under the best circumstances, this pace would be difficult to achieve. Under the actual circumstances—where supply chain disruptions are impacting 88% of construction projects and nearly 90% of construction firms cannot find enough skilled craftsmen to meet demand—it feels like a Sisyphean task.

The real estate market is nuanced from state to state, and while many national trends hold true at a more localized level, it is important to understand the context of your individual state.

To analyze every state’s real estate market, rent-to-own platform ZeroDown compiled current and historical data from the U.S. Census Bureau and the Department of Housing and Urban Development. The data will cover homeownership rates, vacancies, foreclosures, mortgages, new housing construction, and manufacturing, as well as housing characteristics such as the median age, square feet, and the number of rooms for homes in your state.

Oregon by the numbers

– Homeownership rate: 67.6%
– Homeowner vacancy rate: 0.8%
– Rental vacancy rate: 5.8%
– Occupied housing units: 1,649,352
— Owner-occupied housing units: 1,037,125, renter-occupied housing units: 612,227
— Year homes were built: 2014 or later (4.3%), 2010 to 2013 (2.3%), 2000 to 2009 (14.0%), 1980 to 1999 (27.7%), 1960 to 1979 (27.7%), 1940 to 1959 (12.9%), 1939 or earlier (11.0%)
— Number of bedrooms: no bedroom (3.6%), 1 bedroom (9.7%), 2 or 3 bedrooms (68.0%), 4 or more bedrooms (18.7%)
— Type of heating used: utility gas (36.9%), bottled, tank, or LP gas (1.8%), electricity (52.4%), fuel oil, kerosene, etc. (1.6%), coal or coke (0.0%), all other fuels (6.9%), no fuel used (0.4%)
– New building permits: 18,665 ($4,067,001 value)
– Manufactured homes shipped to state: 1,089 (average sales price: $106,700)

The COVID-19 pandemic created a world where some people found the financial flexibility to purchase a home—and an incentive to do so quickly. Remote work, shutdowns, and record-low mortgage rates pushed people—particularly those under 35—who may have otherwise delayed home buying to suddenly seek out more space for themselves, their families, and a yard for their pandemic puppies in cheaper neighborhoods away from employment hubs and large metros.

For others, the pandemic created a new reality of financial insecurity, delinquent mortgage or rent payments, risk of eviction, and being priced out of previously affordable neighborhoods. Nearly a quarter of households earning less than $25,000 annually were behind on mortgage payments as of early 2021. In that same time frame, one-fifth of all renters in the U.S. were behind on their monthly payments. Within these overall figures, the burden of the economic fallout due to the pandemic falls disproportionately on low-income and minority families.

Continue reading to learn how the real estate market is faring for your state’s neighbors.

California by the numbers

– Homeownership rate: 54.4%
– Homeowner vacancy rate: 0.6%
– Rental vacancy rate: 4.0%
– Occupied housing units: 13,157,873
— Owner-occupied housing units: 7,218,742, renter-occupied housing units: 5,939,131
— Year homes were built: 2014 or later (2.9%), 2010 to 2013 (1.7%), 2000 to 2009 (10.8%), 1980 to 1999 (25.7%), 1960 to 1979 (30.8%), 1940 to 1959 (19.2%), 1939 or earlier (8.9%)
— Number of bedrooms: no bedroom (4.2%), 1 bedroom (13.3%), 2 or 3 bedrooms (60.4%), 4 or more bedrooms (22.2%)
— Type of heating used: utility gas (64.4%), bottled, tank, or LP gas (3.2%), electricity (26.6%), fuel oil, kerosene, etc. (0.2%), coal or coke (0.0%), all other fuels (2.5%), no fuel used (3.1%)
– New building permits: 106,075 ($25,423,120 value)
– Manufactured homes shipped to state: 2,243 (average sales price: $118,700)

Idaho by the numbers

– Homeownership rate: 71.4%
– Homeowner vacancy rate: 1.0%
– Rental vacancy rate: 3.4%
– Occupied housing units: 655,859
— Owner-occupied housing units: 469,387, renter-occupied housing units: 186,472
— Year homes were built: 2014 or later (8.0%), 2010 to 2013 (3.3%), 2000 to 2009 (19.8%), 1980 to 1999 (27.8%), 1960 to 1979 (23.3%), 1940 to 1959 (9.4%), 1939 or earlier (8.4%)
— Number of bedrooms: no bedroom (1.5%), 1 bedroom (5.7%), 2 or 3 bedrooms (62.9%), 4 or more bedrooms (29.9%)
— Type of heating used: utility gas (50.9%), bottled, tank, or LP gas (5.2%), electricity (34.4%), fuel oil, kerosene, etc. (1.5%), coal or coke (0.0%), all other fuels (7.6%), no fuel used (0.3%)
– New building permits: 19,130 ($3,948,590 value)
– Manufactured homes shipped to state: 376 (average sales price: $108,900)

The Perks of Putting 20% Down on a Home

The Perks of Putting 20% Down on a Home | MyKCM

If you’re thinking of buying a home, you’re probably wondering what you need to save for your down payment. Is it 20% of the purchase price, or could you put down less? While there are lower down payment programs available that allow qualified buyers to put down as little as 3.5%, it’s important to understand the many perks that come with a 20% down payment.

Here are four reasons why putting 20% down may be a great option if it works within your budget.

1. Your Interest Rate May Be Lower

A 20% down payment vs. a 3-5% down payment shows your lender you’re more financially stable and not a large credit risk. The more confident your lender is in your credit score and your ability to pay your loan, the lower the mortgage interest rate they’ll likely be willing to give you.

2. You’ll End Up Paying Less for Your Home

The larger your down payment, the smaller your loan amount will be for your mortgage. If you’re able to pay 20% of the cost of your new home at the start of the transaction, you’ll only pay interest on the remaining 80%. If you put down 5%, the additional 15% will be added to your loan and will accrue interest over time. This will end up costing you more over the lifetime of your home loan.

3. Your Offer Will Stand Out in a Competitive Market

In a market where many buyers are competing for the same home, sellers often like to see offers come in with 20% or larger down payments. The seller gains the same confidence as the lender in this scenario. You are seen as a stronger buyer with financing that’s more likely to be approved. Therefore, the deal will be more likely to go through.

4. You Won’t Have To Pay Private Mortgage Insurance (PMI)

What is PMI? According to Freddie Mac:

“For homeowners who put less than 20% down, Private Mortgage Insurance or PMI is an added insurance policy for homeowners that protects the lender if you are unable to pay your mortgage.

It is not the same thing as homeowner’s insurance. It’s a monthly fee, rolled into your mortgage payment, that’s required if you make a down payment less than 20%. . . . Once you’ve built equity of 20% in your home, you can cancel your PMI and remove that expense from your monthly payment.”

As mentioned earlier, if you put down less than 20% when buying a home, your lender will see your loan as having more risk. PMI helps them recover their investment in you if you’re unable to pay your loan. This insurance isn’t required if you’re able to put down 20% or more.

Many times, home sellers looking to move up to a larger or more expensive home are able to take the equity they earn from the sale of their house to put 20% down on their next home. With the equity homeowners have today, it creates a great opportunity to put those savings toward a larger down payment on a new home.

Bottom Line

If you’re looking to buy a home, consider the benefits of 20% down versus a smaller down payment option. Let’s connect so you have expert advice to help make your homeownership goals a reality.

Weekly Market Stats

December 21, 2021
Portland Metro Area (OR and WA)
Market Activity for the Week of December 13 through December 19, 2021 

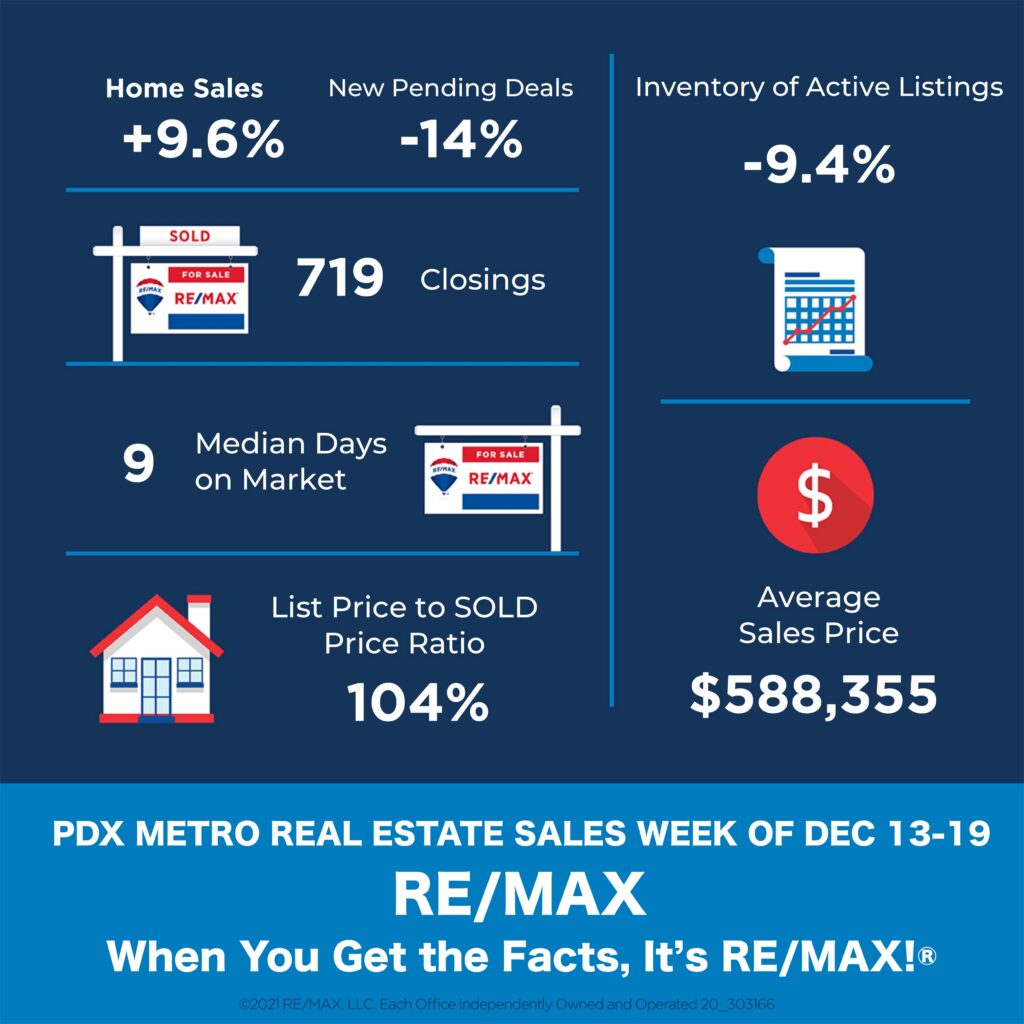
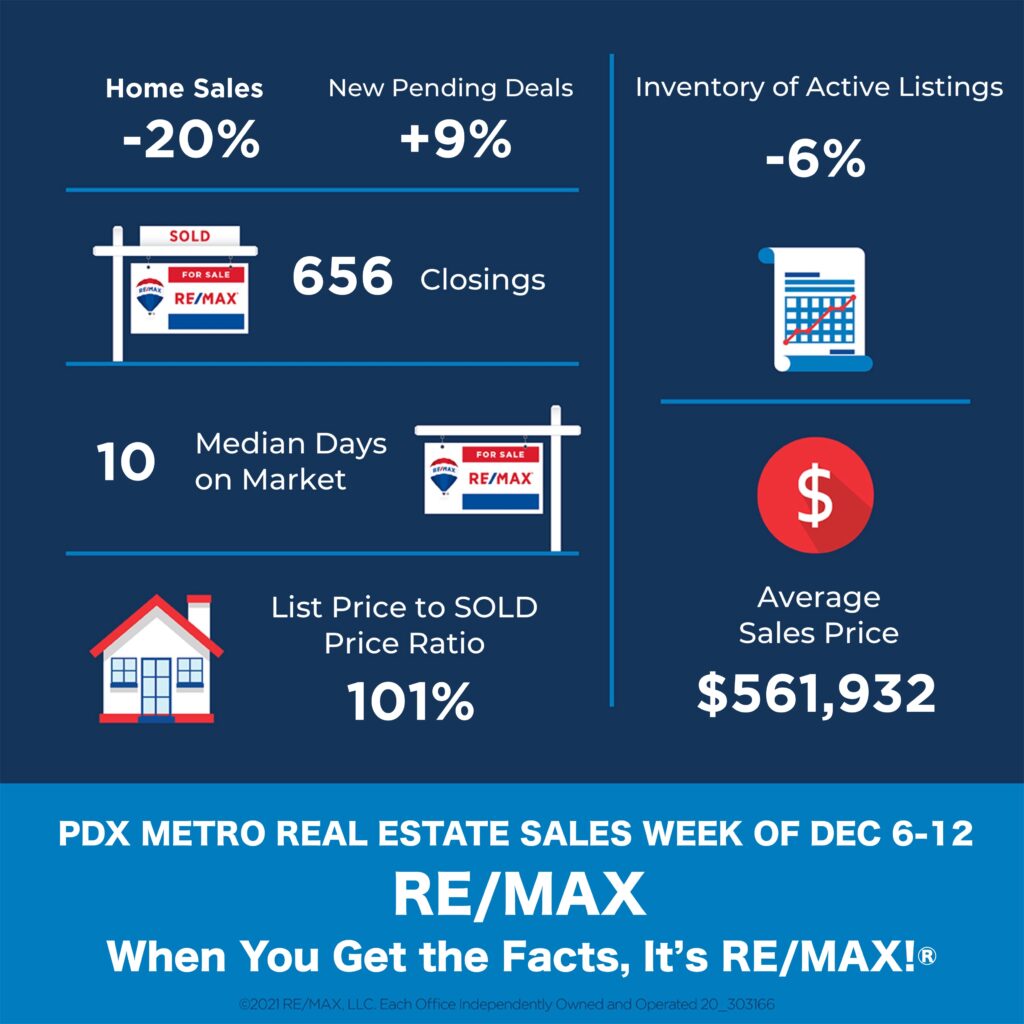
Homes Sold: 719 vs previous weeks: 656; 821; 503; 814; 701; 699; 888; 772; 751; 743; 939, 722; 809; 625; 888; 833; 843; 770; 698; 895; 793; 868; 732; 1035; 1035; 917; 802; 737; 685; 896; 792; 807; 749; 848; 684; 733; 687; 687; and 581. During the same week last year, this number was 914.

Active Listings: 2020 vs previous weeks: 2232; 2376; 2459; 2719; 2905; 2984; 3128; 3341; 3514; 3556; 3583; 3667; 3604; 3614; 3439; 3595; 3555; 3498; 3487; 3427; 3446; 3278; 3209; 3425; 3091; 2967; 2822; 2744; 2568; 2593; 2476; 2289; 2265; 2173; 2275 2252; 2163; 2135; and 1998. 

Total number of Pending Deals: 4499 vs previous weeks: 5035; 5355; 5399; 5535; 5626; 5638; 5844; 5827; 5941; 5890; 6005; 6032; 6000; 6020; 6126; 6294; 6293; 6294; 6195; 6244; 6256; 6250; 6186; 6586; 6593; 6664; 6546; 6587; 6640; 6561; 6501; 6388; 6393; 6216; 6049; 5894; 5835 and 5779.

New Active Listings: 251 vs previous weeks: 335; 404; 219; 431; 494; 514; 506; 539; 653; 661; 668; 740; 718; 789; 564; 698; 722; 714.

New Pending Deals: 609 vs previous weeks: 714; 656; 869; 853; 889; 919; 993; 944; 938; 1009; 970; 1052; 842; 966; 975; 973; 1046; 1002; 1074; 1049; 1101; 836; 934; 1030; 1050; 1068; 904; 1084; 1117; 1079; 998; 1037; 1088; 952; and 894. 

Average Days on Market 24 (34 last year)

Median Days on Market 9 (12 last year)

Average Sale price – $588,355 vs $515,103 during the same week last year.

Median Sale price – $520,000 vs $455,000 during the same week last year .

Total Sales Volume – $423,027,245 vs $470,804,142 during the same week last year.

Average List Price vs Sale Price
Average Sale Price as a Percentage of the Asking Price  – 100.34%
Median Sale Price as a Percentage of the Asking Price – 104.01%
Average Sale Price as a Percentage of the Original Asking Price – 100.17%

The Average Homeowner Gained $56,700 in Equity over the Past Year

The Average Homeowner Gained over $56,700 in Equity over the Past Year | MyKCM

When you think of homeownership, what’s the first thing that comes to mind? Chances are you might focus on the non-financial benefits, like the security or stability a home provides. But what about equity? While it can be overlooked, a homeowner’s equity helps build long-term wealth over time. Here’s a look at what equity is and why it matters.

For a homeowner, your equity is the current value of your home minus what you owe on the loan. So, as home values climb, your equity does too. That’s exactly what’s happening today. There aren’t enough homes on the market to meet buyer demand, so bidding wars and multiple offers are driving prices up. That’s because people are willing to pay more to buy a home. Right now, this low supply and high demand are giving current homeowners a significant equity boost.

Dr. Frank Nothaft, Chief Economist at CoreLogic, explains it like this:

Home price growth is the principal driver of home equity creation. The CoreLogic Home Price Index reported home prices were up 17.7% for the past 12 months ending September, spurring the record gains in home equity wealth.

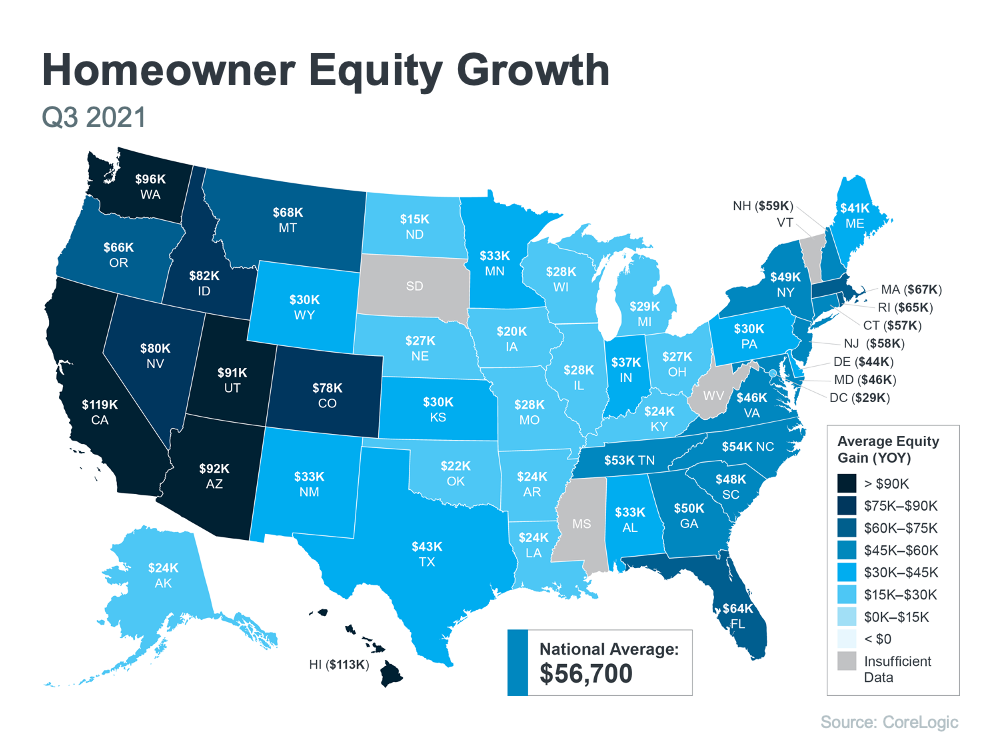
To find out just how much rising home values have impacted equity, we turn to the latest Homeowner Equity Insights from CoreLogic. According to that report, the average homeowner’s equity has grown by $56,700 over the last 12 months.

The Average Homeowner Gained over $56,700 in Equity over the Past Year | MyKCM

Curious how your state stacks up? Check out the map below to find out the average equity gain for your area.

How Rising Equity Impacts You

If you’re already a homeowner, equity not only builds your wealth, it also opens doors for you to achieve your goals. It works like this: when you sell your house, the equity you built up comes back to you in the sale. You can use those proceeds to fuel your next move, especially if you’ve decided your needs have changed and you’re looking for something new.

If you’re thinking about becoming a homeowner, understanding the importance of equity can help you realize why homeownership is a worthwhile goal. It builds your wealth and gives you peace of mind that your investment is a wise one, not just from a lifestyle perspective, but from a financial one too.

Bottom Line

Whether you’re a current homeowner or you’re ready to become one, it’s important to know how equity works and why it matters. If this inspires you to make a move, let’s connect to explore your options and find out what steps you need to take next.

Homebuyers Are Going on a Shopping Spree This Winter

Homebuyers Are Going on a Shopping Spree This Winter | MyKCM

Black Friday and Cyber Monday are over, which means some shoppers have wrapped up their holiday buying. But there’s still a group of buyers that are very active this holiday season – homebuyers.

Experts anticipate the real estate market will see a flurry of activity this winter, and that’s great news for today’s sellers. If you’re planning on listing your home, there’s no need to wait until the spring for better conditions – today’s real estate market is already heating up.

Buyers Have Warmed Up to the Idea of Purchasing This Winter

The past 18 months brought about significant lifestyle changes for many of us, including the rise in remote work, job changes, and even early retirement for some. For many people, it’s prompting a search for their next home now rather than waiting for warmer months.

Lawrence Yun, Chief Economist at the National Association of Realtors (NAR), points out how this winter may see a significant number of sales:

“Compared to other past winter seasons, this winter season’s sales activity will be stronger. . . . This winter, there will be more sales compared to pre-pandemic winters going back all the way to 2006.”

You might be wondering: what does strong sales activity mean for you? It means there are likely to be more buyers active in the market this winter – far more than more normal, pre-pandemic years.

In the same article, Danielle Hale, Chief Economist for realtor.com, puts it in these simple terms:

Sellers can expect to see plenty of buyers.”

The more buyers there are in the market, the more likely it is your home will get noticed. That can lead to a multiple-offer scenario or a potential bidding war. Receiving multiple offers on your home means you can select the right offer and terms for your situation – so you can truly win as a seller when you list your house this winter.

Bottom Line

If you’re thinking about selling your house, you don’t need to wait until the spring. Buyers are ready now. Let’s connect to discuss why selling this holiday season could be the gift that keeps on giving.

What Everyone Wants To Know: Will Home Prices Decline in 2022?

What Everyone Wants To Know: Will Home Prices Decline in 2022? | MyKCM

If you’re thinking of buying a home in today’s housing market, you may be wondering how strong your investment will be. You might be asking yourself: if I buy a home now, will it lose value? Or will it continue to appreciate going forward? The good news is, according to the experts, home prices are not projected to decline. Here’s why.

With buyers still outweighing sellers, home prices are forecast to continue climbing in 2022, just at a slower or more moderate pace. Why the continued increase? It’s the simple law of supply and demand. When there are fewer items on the market than there are buyers, the competition for that item makes prices naturally rise.

And while the number of homes for sale today is expected to improve with more sellers getting ready to list their houses this winter, we’re certainly not out of the inventory woods yet. Thus, the projections show continued appreciation, but at a more moderate rate than what we’ve seen over the past year.

What Everyone Wants To Know: Will Home Prices Decline in 2022? | MyKCM

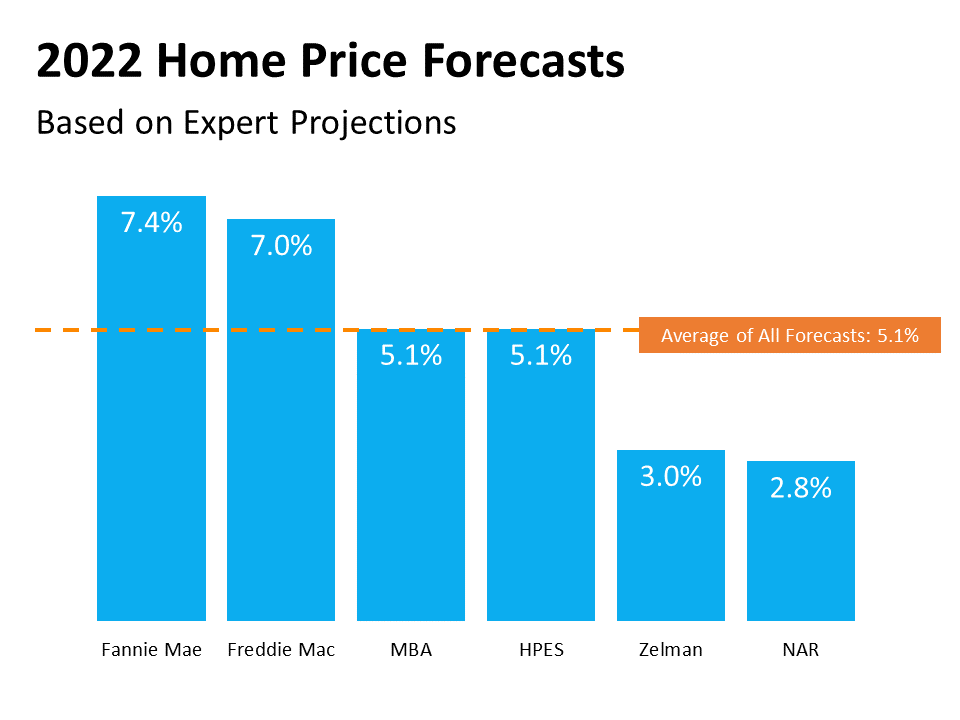
Here’s a look at the latest 2022 expert forecasts on home price appreciation:What’s the biggest takeaway from this graph? None of the major experts are projecting depreciation in 2022. They’re all showing an increase in home prices next year.

And here’s what some of the industry’s experts say about how that will play out in the housing market next year:

Brad Hunter of Hunter Housing Economics explains:

“. . . the recent unsustainable rate of home price appreciation will slow sharply. . . . home prices will not decline. . . but they will simply rise at a more sustainable pace.”

Danielle Hale from realtor.com agrees:

Price growth is expected to move back toward a normal range, but this is on top of recent high prices, . . . So prices will [still] hit new highs. . . . The pace of price growth is going to slow notably . . . ”

What Does This Mean for the Housing Market?

While home price appreciation is expected to continue, it isn’t projected to be the record-breaking 18 to almost 20% increase the market saw over the past 12 months. Overall, it’s important to note that price increases won’t be as monumental as they were in 2021 – but they certainly won’t decline anytime soon.

What Does That Mean for You?

With motivated buyers in the market and so few homes available to purchase, the imbalance of supply and demand will continue to put upward pressure on home prices in 2022. And when home price appreciation is in the forecast, that’s a clear indication your investment in homeownership is a sound one.

Bottom Line

It’s important to know that home prices are not projected to decline in the new year. Instead, they’re forecast to rise, just at a more moderate pace. Let’s connect to make sure you’re up to date on what’s happening with home price appreciation in our market, so you can make an informed decision about your next move.

Advice for First-Generation Homebuyers

Advice for First-Generation Homebuyers | MyKCM

The sense of pride you’ll feel when you purchase a home can’t be overstated. For first-generation homebuyers, that feeling of accomplishment is even greater. That’s because the pride of homeownership for first-generation buyers extends far beyond the homebuyer. AJ Barkley, Head of Neighborhood and Community Lending for Bank of Americasays:

“Achieving this goal can create a sense of pride and accomplishment that resonates both for the buyer and those closest to them, including their parents and future generations.”

In other words, your dream of homeownership has far-reaching impacts. If you’re about to be the first person in your family to buy a home, let that motivate you throughout the process. As you begin your journey, here are three helpful tips to make that dream come true.

1. Reach Out to a Real Estate Professional

It’s important to reach out to a trusted advisor early in your homebuying process. Not only can an agent help you find the right home, but they’ll serve as your expert advisor and answer any questions you might have along the way.

Advice for First-Generation Homebuyers | MyKCM

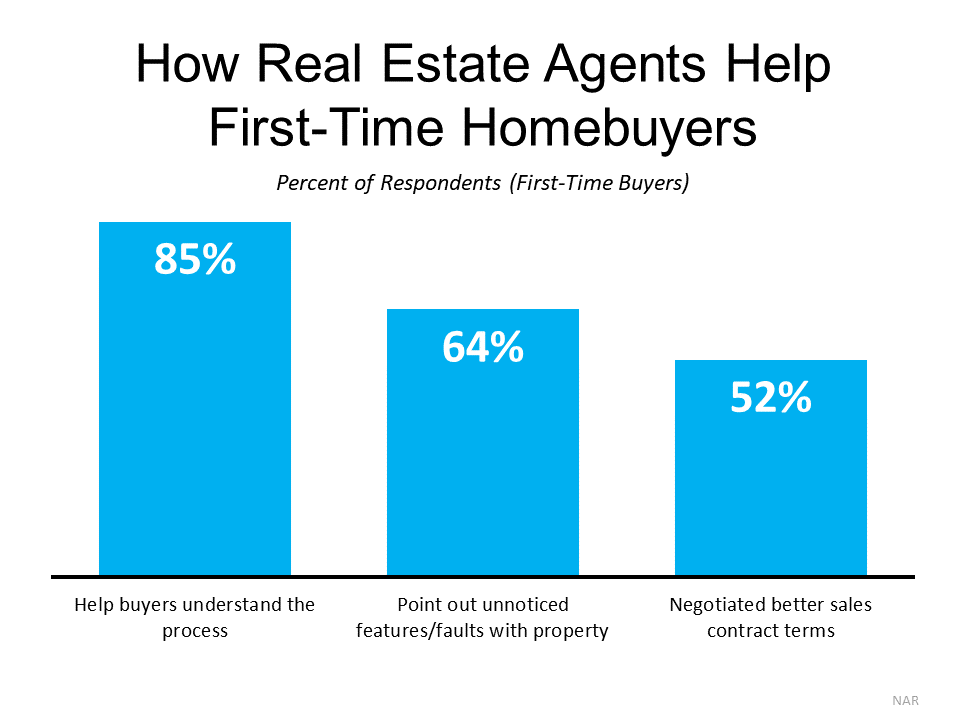
The latest Profile of Home Buyers and Sellers from the National Association of Realtors (NAR) surveyed first-time homebuyers to see how their agent helped them with their home purchase (see chart below):

As the graph shows, your agent is a great source of information throughout the process. They’ll help you understand what’s happening, assess a home’s condition, and negotiate a contract that has the best possible terms for you. These are just some of the reasons having an expert in your corner is critical as you navigate one of the most significant purchases of your life.

2. Do Your Research and Know What You Can Afford

The second piece of advice for first-generation homebuyers is practical: do your research so you know what you can afford. That means getting your finances in order, reviewing your budget, and getting pre-approved through a lender. It also means learning the ins and outs of what it takes to pay for your home, including what you’ll need for a down payment.

Many homebuyers believe the common misconception that you can’t purchase a home without coming up with a 20% for a down payment. As Freddie Mac says:

“The most damaging down payment myth—since it stops the homebuying process before it can start—is the belief that 20% is necessary.”

Advice for First-Generation Homebuyers | MyKCM

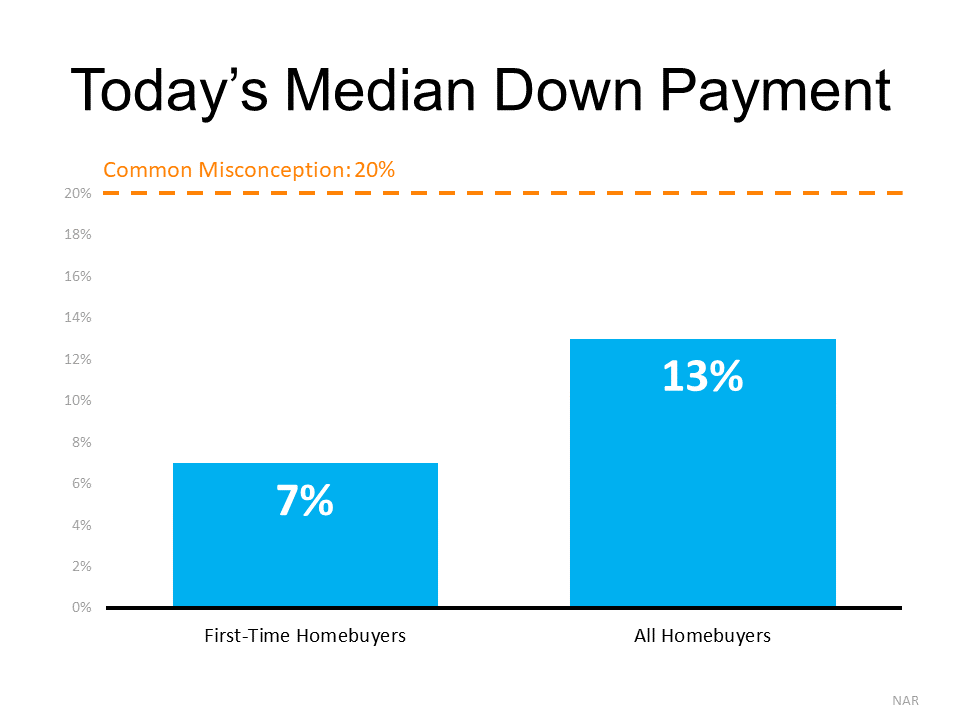
The chart below shows what recent homebuyers have actually put down on their purchases:

On average, first-time buyers only put 7% down on their home purchase. That’s far less than the 20% many people believe is necessary. That means your down payment, and your home purchase, may be in closer reach than you realize. Keep that in mind as you work with a real estate professional to better understand what you’ll need for your purchase.

3. Don’t Lose Sight of What Home Means to You

Finally, it’s important keep in mind why you’re searching for a home to begin with. Overwhelmingly, first-generation homeowners recognize the financial and non-financial benefits of owning a home. In fact, in a recent survey:

  • 73% of first-generation homeowners say the safety and security homeownership provides is increasing in importance.
  • Nearly two-thirds of first-generation homeowners say the importance of building equity in a home is growing more important as well.

As AJ Barkley explains:

“For many first-generation homeowners and their families, homeownership has a unique importance, given the collective efforts to overcome financial challenges that can often span generations…”

Bottom Line

If you’re a first-generation homebuyer, being prepared and working with a trusted expert is key to achieving your dream. Let’s connect today so you can get started on your path to homeownership.

If You Think the Housing Market Will Slow This Winter, Think Again.

If You Think the Housing Market Will Slow This Winter, Think Again. | MyKCM

From the opportunity to take advantage of today’s low mortgage rates to changing homeowner needs, Americans have more motivation than ever to buy a home. According to the experts, buyers are making moves right now, creating an unseasonably strong housing market for this time of year.

As we wrap up the fall season and move into the winter months, here’s a look at what several industry leaders have to say about the continued momentum in the current market, and what it means as we head into the early part of next year.

Lawrence Yun, Chief Economist, National Association of Realtors (NAR)

“This solid buying is a testament to demand still being relatively high, as it is occurring during a time when inventory is still markedly low. The notable gain in October assures that total existing-home sales in 2021 will exceed 6 million, which will shape up to be the best performance in 15 years.” 

Odeta Kushi, Deputy Chief Economist, First American

“So far in November, purchase applications point to another strong month in sales. Still low rates and demographic demand support this strength, even as affordability and inventory headwinds remain.”

The M Report

“The demand for housing in the United States has reached a fever pitch, a trend that opposes the norm of this time of the year when the market cools as the winter months set in.”

Mark Fleming, Chief Economist, First American

Strong demographic demand will continue to act as the wind in the housing market’s sails.”

What does this mean for the winter housing market?

Buyers are actively in the market, and they’re competing for homes to purchase. With the momentum coming out of this fall, all signs point to the winter housing market picking up steam, making it much busier than in a more typical year. And as we’ve seen in so many ways, 2020 and 2021 were anything but typical in real estate. It looks like 2022 may be joining that list before we know it.

Bottom Line

If you think the housing market will slow down this winter, think again. Whether you’re thinking of buying a home, selling your house, or both – let’s connect to determine if this winter is your best time to make a move too.