December 21, 2021
Portland Metro Area (OR and WA)
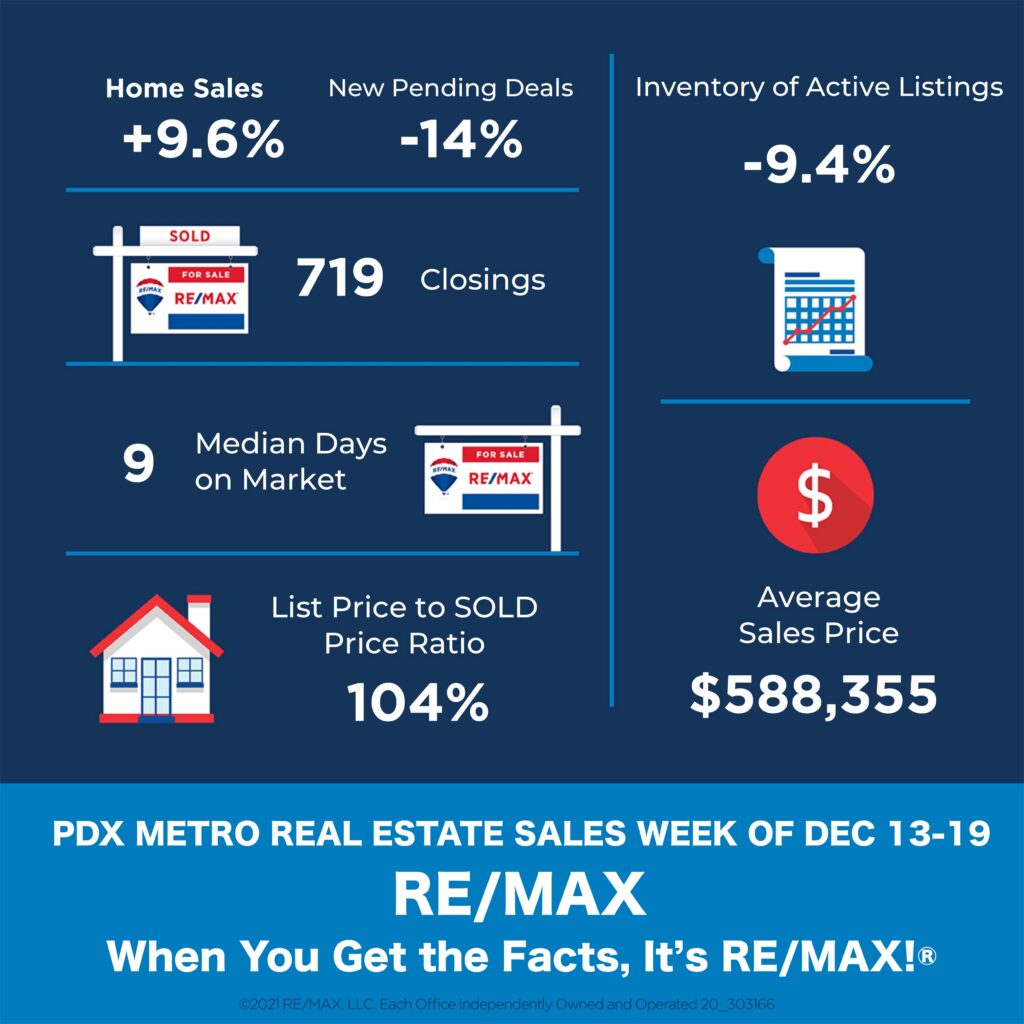
Market Activity for the Week of December 13 through December 19, 2021
Homes Sold: 719 vs previous weeks: 656; 821; 503; 814; 701; 699; 888; 772; 751; 743; 939, 722; 809; 625; 888; 833; 843; 770; 698; 895; 793; 868; 732; 1035; 1035; 917; 802; 737; 685; 896; 792; 807; 749; 848; 684; 733; 687; 687; and 581. During the same week last year, this number was 914.
Active Listings: 2020 vs previous weeks: 2232; 2376; 2459; 2719; 2905; 2984; 3128; 3341; 3514; 3556; 3583; 3667; 3604; 3614; 3439; 3595; 3555; 3498; 3487; 3427; 3446; 3278; 3209; 3425; 3091; 2967; 2822; 2744; 2568; 2593; 2476; 2289; 2265; 2173; 2275 2252; 2163; 2135; and 1998.
Total number of Pending Deals: 4499 vs previous weeks: 5035; 5355; 5399; 5535; 5626; 5638; 5844; 5827; 5941; 5890; 6005; 6032; 6000; 6020; 6126; 6294; 6293; 6294; 6195; 6244; 6256; 6250; 6186; 6586; 6593; 6664; 6546; 6587; 6640; 6561; 6501; 6388; 6393; 6216; 6049; 5894; 5835 and 5779.
New Active Listings: 251 vs previous weeks: 335; 404; 219; 431; 494; 514; 506; 539; 653; 661; 668; 740; 718; 789; 564; 698; 722; 714.
New Pending Deals: 609 vs previous weeks: 714; 656; 869; 853; 889; 919; 993; 944; 938; 1009; 970; 1052; 842; 966; 975; 973; 1046; 1002; 1074; 1049; 1101; 836; 934; 1030; 1050; 1068; 904; 1084; 1117; 1079; 998; 1037; 1088; 952; and 894.
Average Days on Market 24 (34 last year)
Median Days on Market 9 (12 last year)
Average Sale price – $588,355 vs $515,103 during the same week last year.
Median Sale price – $520,000 vs $455,000 during the same week last year .
Total Sales Volume – $423,027,245 vs $470,804,142 during the same week last year.
Average List Price vs Sale Price
Average Sale Price as a Percentage of the Asking Price – 100.34%
Median Sale Price as a Percentage of the Asking Price – 104.01%
Average Sale Price as a Percentage of the Original Asking Price – 100.17%
