Looking To Move? It Could Be Time To Build Your Dream Home.

Looking To Move? It Could Be Time To Build Your Dream Home. | MyKCM

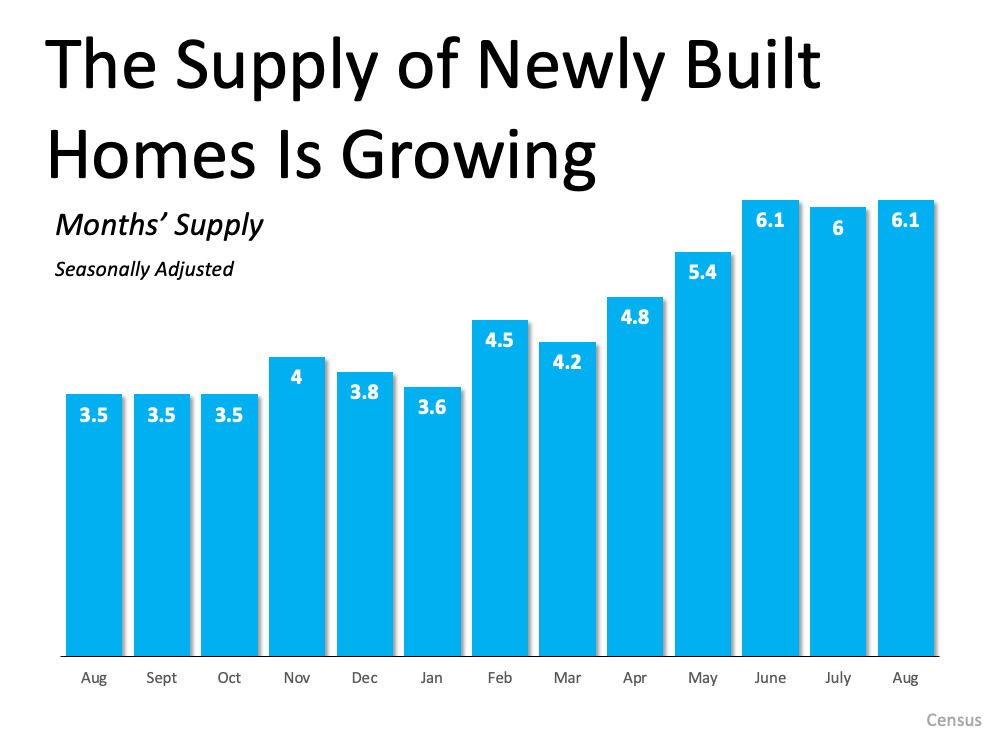
While today’s supply of homes for sale is still low, the number of newly built homes is increasing. If you’re ready to sell but have held off because you weren’t sure you’d be able to find a home to move into, newly built homes and those under construction can provide the options you’ve been waiting for.

Looking To Move? It Could Be Time To Build Your Dream Home. | MyKCM

The latest Census data shows the inventory of new homes is increasing this year (see graph below):With more new homes coming to the market, this means you’ll have more options to choose from if you’re ready to buy. Of course, if you do consider a newly built home, you’ll want to keep timing in mind. The supply shown in the graph above includes homes at various stages of the construction process – some are near completion while others may be months away.

According to Robert Dietz, Chief Economist and Senior VP for Economics and Housing Policy for the National Association of Home Builders (NAHB):

28% of new home inventory consists of homes that have not started construction, compared to 21% a year ago.”

Buying a home near completion is great if you’re ready to move. Alternatively, a home that has yet to break ground might benefit you if you’re ready to sell and you aren’t on a strict timeline. You’ll have an even greater opportunity to design your future home to suit your needs. No matter what, your trusted real estate advisor can help you find a home that works for you.

Bottom Line

If you want to take advantage of today’s sellers’ market, but you’re not sure if you’ll be able to find a home to move into, consider a newly built home. Let’s connect today so you have a trusted real estate advisor to guide you through the sale of your house and discuss your homebuying options.

What Does the Future Hold for Home Prices?

What Does the Future Hold for Home Prices? | MyKCM

If you’re looking to buy or sell a house, chances are you’ve heard talk about today’s rising home prices. And while this increase in home values is great news for sellers, you may be wondering what the future holds. Will prices continue to rise with time, or should you expect them to fall?

To answer that question, let’s first understand a few terms you may be hearing right now.

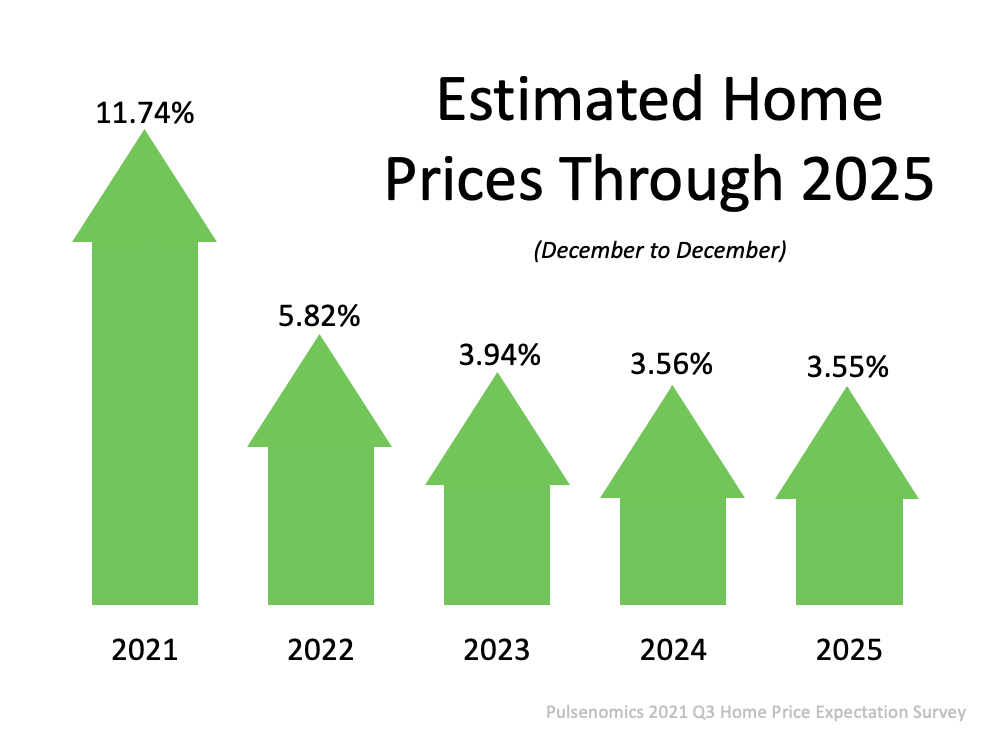
It’s important to note home prices have increased, or appreciated, for 114 straight months. To find out if that trend may continue, look to the experts. Pulsenomics surveyed over 100 economists, investment strategists, and housing market analysts asking for their five-year projections. In terms of what lies ahead, experts say the market may see some slight deceleration, but not depreciation.

What Does the Future Hold for Home Prices? | MyKCM

Here’s the forecast for the next few years:As the graph above shows, prices are expected to continue to rise, just not at the same pace we’ve seen over the last year. Over 100 experts agree, there is no expectation for price depreciation. As the arrows indicate, each number is an increase, which means prices will rise each year.

Bill McBride, author of the blog Calculated Risk, also expects deceleration, but not depreciation:

“My sense is the Case-Shiller National annual growth rate of 19.7% is probably close to a peak, and that year-over-year price increases will slow later this year.”

Ivy Zelman of Zelman & Associates agrees, saying:

“. . . home price appreciation is on the cusp of flipping to a decelerating trend.”

recent article from realtor.com indicates you should expect:

“. . . annual price increases will slow to a more normal level, . . .”

What Does This Deceleration Mean for You?

What experts are projecting for the years ahead is more in line with the historical norm for appreciation. According to data from Black Knight, the average annual appreciation from 1995-2020 is 4.1%. As you can see from the chart above, the expert forecasts are closer to that pace, which means you should see appreciation at a level that’s aligned with a more normal year.

If you’re a buyer, don’t expect a sudden or drastic drop in home prices – experts say it won’t happen. Instead, think about your homeownership goals and consider purchasing a home before prices rise further.

If you’re a seller, the continued home price appreciation is good news for the value of your house. Work with an agent to list your house for the right price based on market conditions.

Bottom Line

Experts expect price deceleration, not price depreciation over the coming years. Let’s connect to talk through what’s happening in the housing market today, where things are headed, and what it means for you.

Sellers: Your House Could Be an Oasis for Buyers Seeking More Options

Sellers: Your House Could Be an Oasis for Buyers Seeking More Options | MyKCM

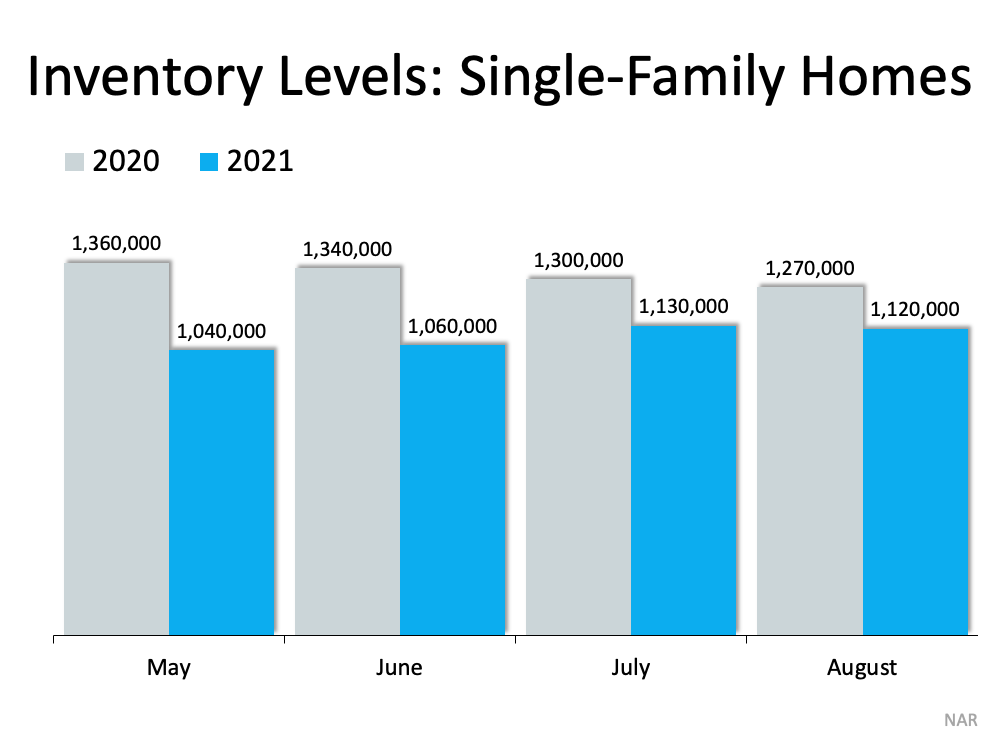
Sellers have a great opportunity this season as buyer demand still heavily outweighs the current supply of homes for sale. According to the National Association of Realtors (NAR), today’s housing inventory sits at only a 2.6-month supply. To put that into perspective, a neutral market typically features a 6-month supply. That places today’s market firmly in the sellers’ market category.

Sellers: Your House Could Be an Oasis for Buyers Seeking More Options | MyKCM

That same NAR data also shows today’s inventory of single-family homes is trailing behind the level we saw last year (see graph below):Because of the ongoing supply challenges, buyers can feel like they’re wandering across a vast, empty desert when searching for their next home. That means your house could provide an oasis for buyers thirsty for options – and it could increase the chances of buyers entering a bidding war for your home.

The latest Realtors Confidence Index Survey from NAR shows houses are receiving an average of 3.8 offers. A multiple-offer scenario lets you select the best offer and gives you incredible leverage when you sell this fall.

Bottom Line

Buyers today are looking for relief as they wander today’s inventory desert. Listing your house this fall – before more options appear – gives your house the best chance to be noticed by multiple buyers. Let’s connect today so your house can stand out as the oasis it truly is.

Weekly Stats

October 19, 2021
Portland Metro Area (OR and WA)
Market Activity for the Week of October 11 through October 17, 2021 

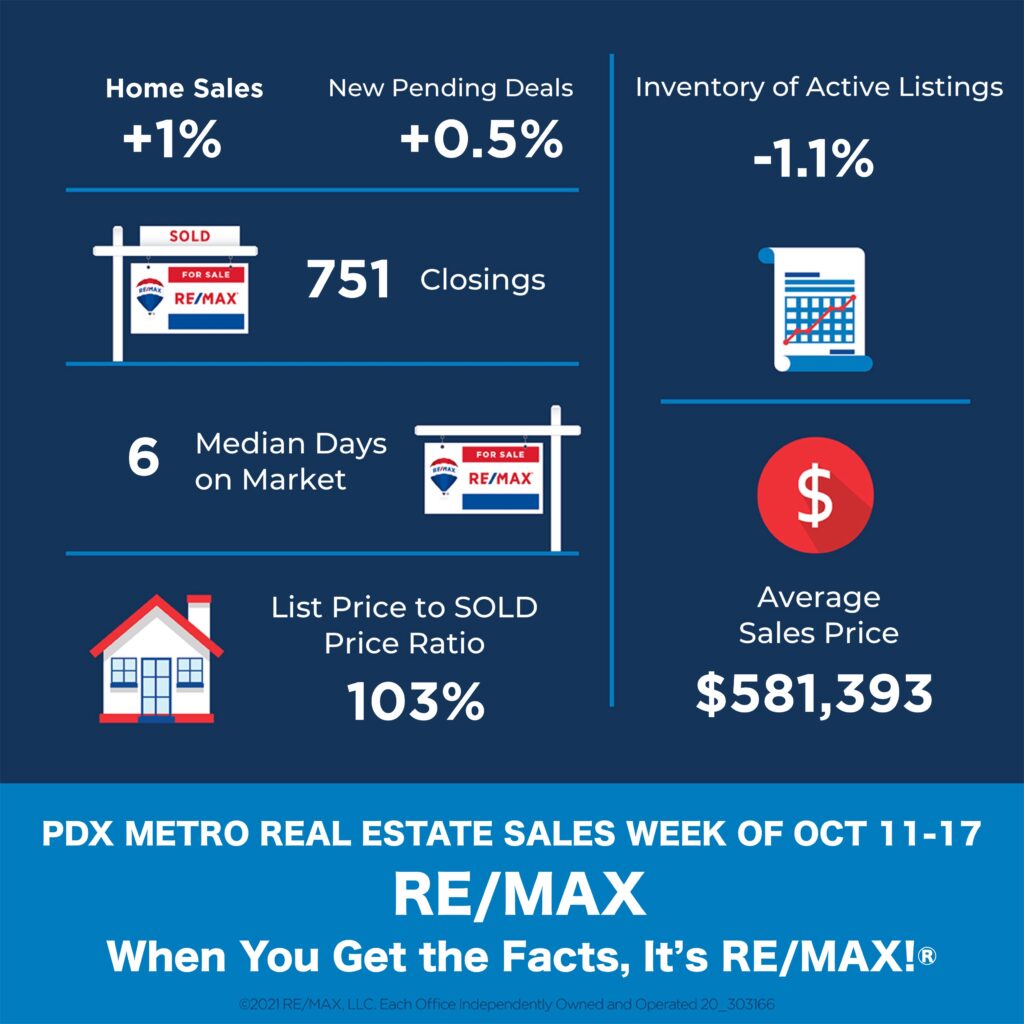
Homes Sold: 751 vs previous weeks: 743; 939, 722; 809; 625; 888; 833; 843; 770; 698; 895; 793; 868; 732; 1035; 1035; 917; 802; 737; 685; 896; 792; 807; 749; 848; 684; 733; 687; 687; and 581. During the same week last year, this number was 823.

Active Listings: 3514 vs previous weeks: 3556; 3583; 3667; 3604; 3614; 3439; 3595; 3555; 3498; 3487; 3427; 3446; 3278; 3209; 3425; 3091; 2967; 2822; 2744; 2568; 2593; 2476; 2289; 2265; 2173; 2275 2252; 2163; 2135; and 1998. 

Total number of Pending Deals: 5827 vs previous weeks: 5941; 5890; 6005; 6032; 6000; 6020; 6126; 6294; 6293; 6294; 6195; 6244; 6256; 6250; 6186; 6586; 6593; 6664; 6546; 6587; 6640; 6561; 6501; 6388; 6393; 6216; 6049; 5894; 5835 and 5779.

New Active Listings: 653 vs previous weeks: 661; 668; 740; 718; 789; 564; 698; 722; 714.

New Pending Deals: 944 vs previous weeks: 938; 1009; 970; 1052; 842; 966; 975; 973; 1046; 1002; 1074; 1049; 1101; 836; 934; 1030; 1050; 1068; 904; 1084; 1117; 1079; 998; 1037; 1088; 952; and 894. 

Average Days on Market 20 (340 last year)

Median Days on Market 6 (7 last year)

Average Sale price – $581,394 vs $520,063 during the same week last year.

Median Sale price – $515,000 vs $457,900 during the same week last year .

Total Sales Volume – $436,626,894 vs $417,090,526 during the same week last year.

Average List Price vs Sale Price
Average Sale Price as a Percentage of the Asking Price  – 101.79%
Median Sale Price as a Percentage of the Asking Price – 103.21%
Average Sale Price as a Percentage of the Original Asking Price – 100.5%

Homebuyer Tips for Finding the One [INFOGRAPHIC]

Homebuyer Tips for Finding the One [INFOGRAPHIC] | MyKCM

Some Highlights

  • The best advice carries across multiple areas of life. When it comes to homebuying, a few simple tips can help you stay on track.
  • Because of increased demand, you’ll need to be patient and embrace compromises during your search. Then, once you’ve fallen in love, commit by putting your best offer forward.
  • If you’re looking to buy a home this year, let’s connect so you have a dedicated partner and teammate to help you find the one.

Weekly Stats

October 12th
Portland Metro Area (OR and WA)
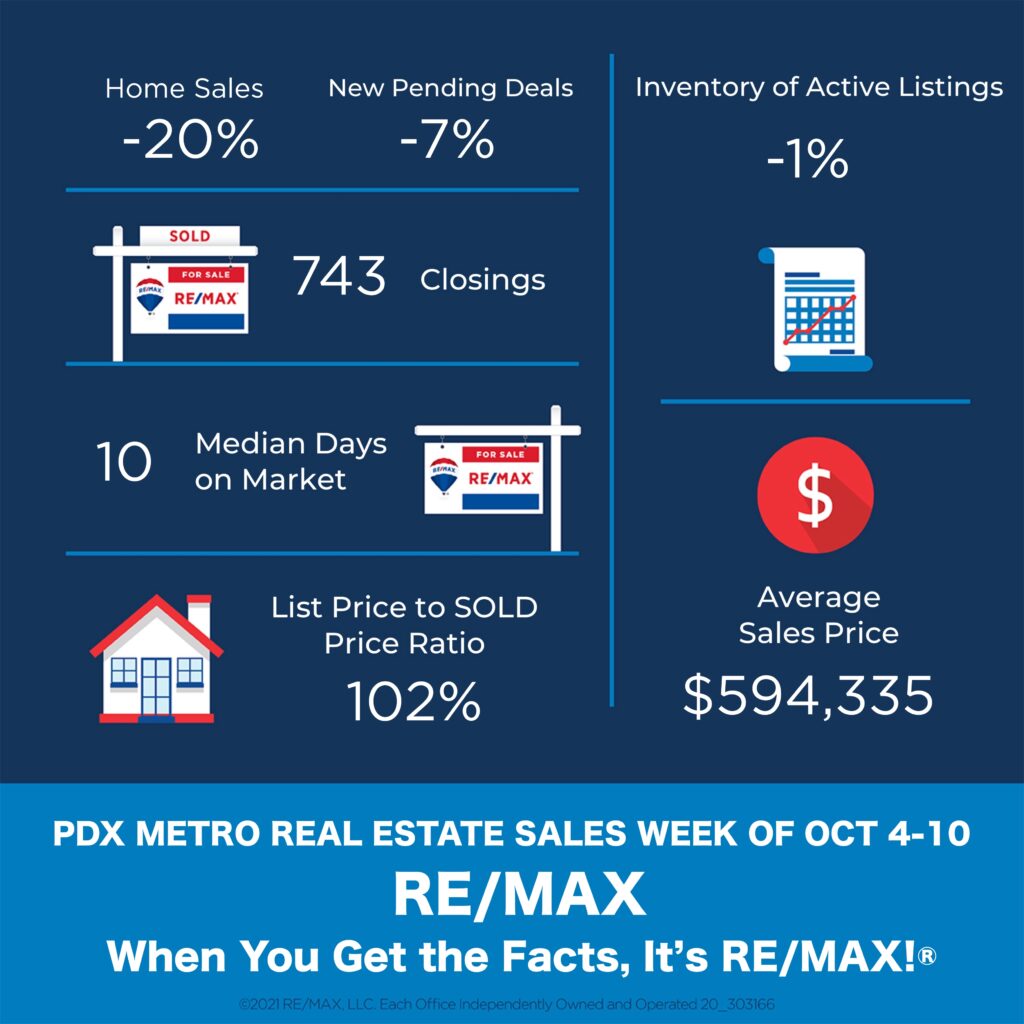
Market Activity for the Week of October 4th through October 10th 

Homes Sold: 743 vs previous weeks: 939; 722; 809; 625; 888; 833; 843; 770; 698; 895; 793; 868; 732; 1035; 1035; 917; 802; 737; 685; 896; 792; 807; 749; 848; 684; 733; 687; 687; and 581. During the same week last year, this number was 860.

Active Listings: 3556 vs previous weeks: 3583; 3667; 3604; 3614; 3439; 3595; 3555; 3498; 3487; 3427; 3446; 3278; 3209; 3425; 3091; 2967; 2822; 2744; 2568; 2593; 2476; 2289; 2265; 2173; 2275 2252; 2163; 2135; and 1998. 

Total number of Pending Deals: 5941 vs previous weeks: 5890; 6005; 6032; 6000; 6020; 6126; 6294; 6293; 6294; 6195; 6244; 6256; 6250; 6186; 6586; 6593; 6664; 6546; 6587; 6640; 6561; 6501; 6388; 6393; 6216; 6049; 5894; 5835 and 5779.

New Active Listings: 661 vs previous weeks: 668; 740; 718; 789; 564; 698; 722; 714.

New Pending Deals: 938 vs previous weeks: 1009; 970; 1052; 842; 966; 975; 973; 1046; 1002; 1074; 1049; 1101; 836; 934; 1030; 1050; 1068; 904; 1084; 1117; 1079; 998; 1037; 1088; 952; and 894. 

Average Days on Market 23 (34 last year)

Median Days on Market 10 (8 last year)

Average Sale price – $594,335 vs $508,223 during the same week last year.

Median Sale price – $520,000 vs $454,000 during the same week last year .

Total Sales Volume – $441,590,905 vs $437,071,780 during the same week last year.

Average List Price vs Sale Price
Average Sale Price as a Percentage of the Asking Price  – 101.35%
Median Sale Price as a Percentage of the Asking Price – 104.01%
Average Sale Price as a Percentage of the Original Asking Price – 101.01%