June 1st
Portland Metro Area (OR and WA)
Market Activity for the Week of May 24th through May 30th
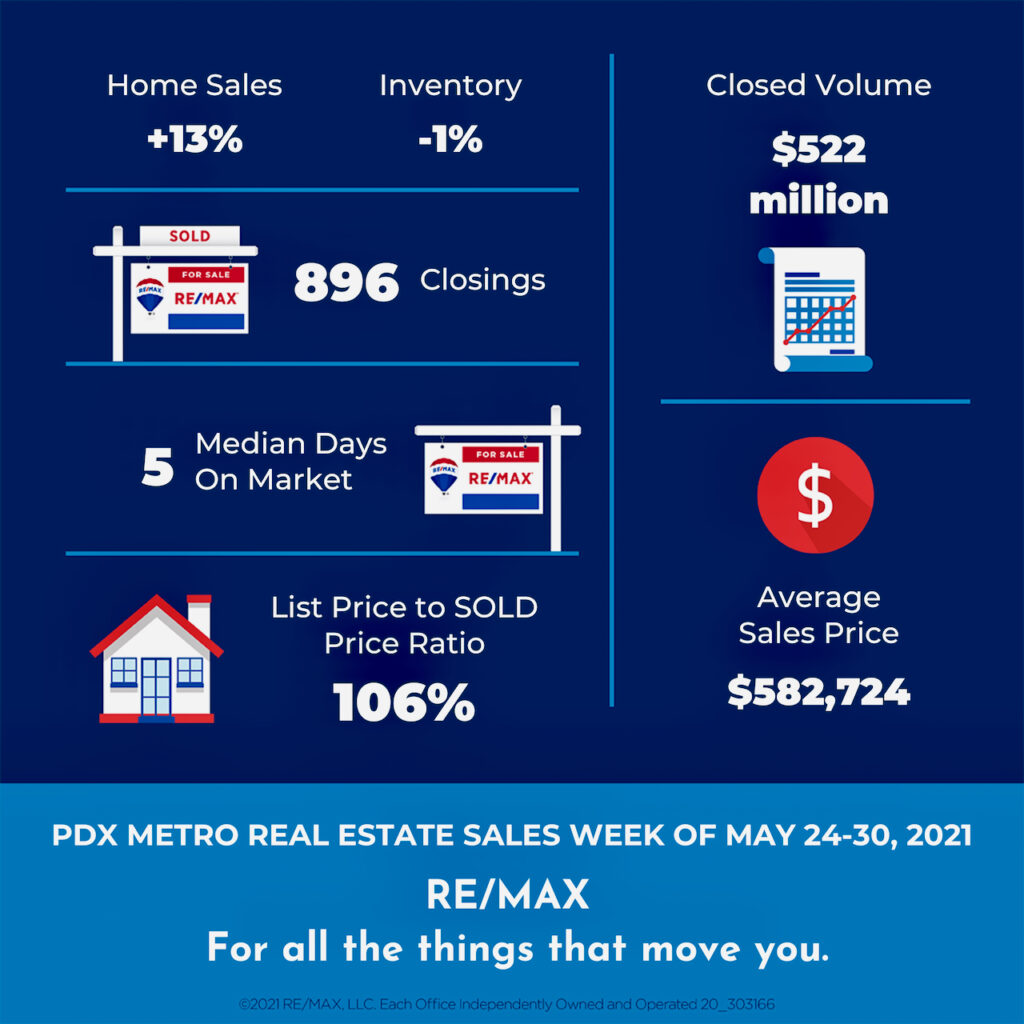
Homes Sold: 896 vs previous weeks: 792; 807; 749; 848; 684; 733; 687; 687; and 581. During the same week last year, this number was 678.
Active Listings: 2568 vs previous weeks: 2593; 2476; 2289; 2265; 2173; 2275 2252; 2163; 2135; and 1998.
Total number of Pending Deals: 6587 vs previous weeks: 6640; 6561; 6501; 6388; 6393; 6216; 6049; 5894; 5835 and 5779.
New Pending Deals: 1084 vs previous weeks: 1117; 1079; 998; 1037; 1088; 952; and 894.
Average Days on Market 15 (33 last year) – Median Days on Market 5 (14 last year).
Average Sale price – $582,724 vs $456,254 during the same week last year.
Total Sales Volume – $522,120,704 vs $309,340,212 during the same week last year.
