Housing Wealth: The Missing Piece of the Affordability Equation

Housing Wealth: The Missing Piece of the Affordability Equation | MyKCM

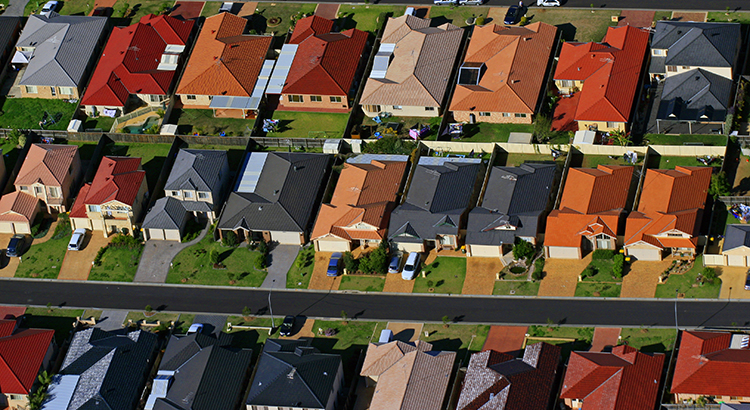
The real estate market is soaring today. Residential home values are rising, and that’s a big win for homeowners. In 2020, there was a double-digit increase in home values – a trend that’s expected to head toward similar levels this year.

However, skyrocketing prices are causing some to start questioning affordability in the current housing market. Many are quick to emphasize the fact that homes today are less affordable than they were last year. Black Knight, a leading provider of data and analytics across the homeownership life cycle, just reported on the issue.

The findings show the historical averages of the national payment to income ratio, which they define as “the share of the median income needed to make the monthly payments on the median-priced home.” Their study reveals:

  • The average over the last 25 years was 23.6%
  • The average over the last 5 years was 20.1%
  • The average today stands at 20.5%

Right now, housing payments are slightly less affordable than the five-year average – but only by less than ½ a percentage point. However, they’re significantly more affordable than the 25-year average. Put another way, a buyer will likely make a slightly greater financial sacrifice to afford a home right now than if they purchased a home within the last five years. On the other hand, it also means the potential financial sacrifice is not nearly as great as it was over the last 25 years.

Does making a sacrifice to buy a home today make financial sense in the long term?

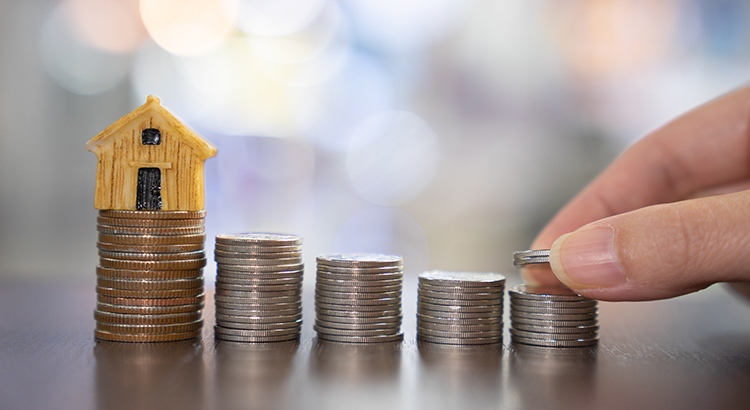
Last week, the Federal Reserve announced that, in the first three months of the year, household net worth increased by $968 billion based solely on the values of the real estate they owned. Another report from CoreLogic reveals the average annual gain in homeowner equity was $33,400 per borrower.

Housing Wealth: The Missing Piece of the Affordability Equation | MyKCM

Homeownership continues to be the cornerstone to building personal wealth. For most Americans, their home is the largest asset they own. On top of that, the difference between the net worth of homeowners and renters is significant at every income level. Here’s a table detailing that point using data from a study done by First American:Owning a home is an essential steppingstone to grow a household’s net worth. Despite the slightly greater sacrifice in the percentage of monthly income you’ll spend on housing today, for most homebuyers, the payoff of starting to build equity now will be worth it.

Bottom Line

Since prices have risen dramatically over the past 18 months, it’s slightly less affordable to buy a home today than it was a year ago. However, when you consider the equity gain and weigh the long-term benefits of building your net worth, you may question if you can afford not to buy now.

Don’t Wait To Sell Your House

Don’t Wait To Sell Your House | MyKCM

We’re in the ultimate sellers’ market right now. If you’re a homeowner thinking about selling, you have a huge advantage in today’s housing market. High buyer demand paired with very few houses for sale makes this the optimal time to sell for those who are ready to do so. Whatever the move you want to make looks like, here’s an overview of what’s creating the prime opportunity to sell this summer.

High Buyer Demand

Demand is strong, and buyers are actively searching for homes to purchase. In the Realtors Confidence Index Survey published monthly by the National Association of Realtors (NAR), buyer traffic is considered “very strong” in almost every state. Homebuyers aren’t just great in number right now – they’re also determined to find their dream home. NAR shows the average home for sale today receives five offers from hopeful buyers. These increasingly frequent bidding wars can drive up the price of your house, which is why high demand from competitive homebuyers is such a win for this summer’s sellers.

Low Inventory of Houses for Sale

Purchaser demand is so high, the market is running out of available homes for sale. Danielle Hale, Chief Economist at realtor.comexplains:

“For most sellers listing sooner rather than later could really pay off with less competition from other sellers and potentially a higher sales price… They’ll also avoid some big unknowns lurking later in the year, namely another possible surge in COVID cases, rising interest rates and the potential for more sellers to enter the market.”

Don’t Wait To Sell Your House | MyKCM

NAR also reveals that unsold inventory sits at a 2.4-months’ supply at the current sales pace. This is far lower than the historical norm of a 6.0-months’ supply. Homes are essentially selling as fast as they’re hitting the market. Below is a graph of the existing inventory of single-family homes for sale:At the same time, homebuilders are increasing construction this year, but they can’t keep up with the growing demand. While reporting on the inventory of newly constructed homes, the U.S. Census Bureau notes:

“The seasonally‐adjusted estimate of new houses for sale at the end of April was 316,000. This represents a supply of 4.4 months at the current sales rate.”

What Does This Mean for You?

If you’re thinking of putting your house on the market, don’t wait. A seller will always negotiate the best deal when demand is high and supply is low. That’s exactly what’s happening in the real estate market today.

Bottom Line

As vaccine rollouts progress and we continue to see the economy recover, more houses will come to the market. Don’t wait for the competition in your neighborhood to increase. If you’re ready to make a move, now is the time to sell. Let’s connect today to get your house listed at this optimal moment in time.

Housing Inventory Explained

Housing Inventory Explained

Hi! I’m Christy Walton with RE/MAX Select in Portland Oregon and if you have been paying attention to the news, economists, or realtors like me, you know that there is a nationwide housing inventory shortage.

What that means is that there are too few real estate listings to match the number of buyers looking for a new home. In other words, we are seeing the basic economic theory of supply and demand in action. Adam Smith would be thrilled!

Right now, demand is more than supply. That means that all of those people who want to buy a home right now are making offers on a very few homes. They are bidding fast and hard for available homes. Supply is low. Demand is high and Prices go up. When the market evens out with more listings becoming available AND some buyers leave the market for one reason or another, prices will even out.

So, back to the definition of housing inventory. I talked about what it does, but what does it mean? Ready?

If we were to disallow new listings, with no more listings being taken, how long would it take for every single residential listing to go under contract? That means every HGTV and magazine perfect home, every condo, every residence, farmhouse, henhouse, outhouse, and doghouse… Uh, sorry. Carried away.

If every residence listed for sale were to go pending, how long would it take?

Right now, in the Portland Metro Area, inventory is at .07 months. For the record, that is 16 days. That is the new lowest record inventory in the 25 years of recorded RMLS history. So, in 16 days, barring new listings and the buyers’ momentum of last month, every listing would be sold. Wow.

For the math-minded driver folks, I will explain how we come up with that number.

1.       Find the total number of active listings on the market last month – 2,339.


2.       Find the total number of sold transactions for last month – 3,183.


3.       Divide the number of active listings by the number of sales. That determines the number of months of inventory remaining – here we get a partial month – .7 months

As a general rule, I consider 4-6 months to be a balanced market. Over 6 months, the market is firmly in the buyers’ favor. Under 4 months, it’s a sellers’ market. At 16 days, it’s very much a sellers’ paradise.

That’s all about inventory! I’m Christy Walton with RE/MAX SELECT in Portland Oregon. Feel free to contact me at www.goodnightchristy.com and check out the site for a free home evaluation, for weekly updates about the Portland housing market, and a lot more real estate information.

Hope Is on the Horizon for Today’s Housing Shortage

Hope Is on the Horizon for Today’s Housing Shortage | MyKCM

The major challenge in today’s housing market is that there are more buyers looking to purchase than there are homes available to buy. Simply put, supply can’t keep up with demand. A normal market has a 6-month supply of homes for sale. Anything over that indicates it’s a buyers’ market, but an inventory level below that threshold means we’re in a sellers’ market. Today’s inventory level sits far below the norm.

According to the Existing Home Sales Report from the National Association of Realtors (NAR):

“Total housing inventory at the end of April amounted to 1.16 million units, up 10.5% from March’s inventory and down 20.5% from one year ago (1.46 million). Unsold inventory sits at a 2.4-month supply at the current sales pace, slightly up from March’s 2.1-month supply and down from the 4.0-month supply recorded in April 2020. These numbers continue to represent near-record lows.”

Hope Is on the Horizon for Today’s Housing Shortage | MyKCM

Basically, while we are seeing some improvement, we’re still at near-record lows for housing inventory (as shown in the graph below). Here’s why. Since the pandemic began, sellers have been cautious when it comes to putting their homes on the market. At the same time that fewer people are listing their homes, more and more people are trying to buy them thanks to today’s low mortgage rates. The influx of buyers aiming to capitalize on those rates are purchasing this limited supply of homes as quickly as they’re coming to market.This inventory shortage doesn’t just apply to existing homes that are already built. When it comes to new construction, builders are trying to do their part to bring more newly built homes into the market. However, due to challenges with things like lumber supply, they’re also not able to keep up with demand. In their Monthly New Residential Sales report, the United States Census Bureau states:

“The seasonally‐adjusted estimate of new houses for sale at the end of April was 316,000. This represents a supply of 4.4 months at the current sales rate.”

Hope Is on the Horizon for Today’s Housing Shortage | MyKCM

Sam Khater, Chief Economist at Freddie Mac, elaborates:

In the span of five decades, entry level construction fell from 418,000 units per year in the late 1970s to 65,000 in 2020.

While in 2020 only 65,000 entry-level homes were completed, there were 2.38 million first-time homebuyers that purchased homes. Not all renters looking to purchase their first home were in the market for entry-level homes, however, the large disparity illustrates the significant and rapidly widening gap between entry-level supply and demand.”

Despite today’s low inventory, there is hope on the horizon.

Regarding existing home sales, Sabrina Speianu, Senior Economic Research Analyst at realtor.com, explains:

“In May, newly listed homes grew by 5.4% on a year-over-year basis compared to the earlier days of the COVID-19 pandemic last year

In May, the share of newly listed homes compared to active daily inventory hit a historical high of 44.4%, 17.3 percentage points higher than last year and 15.1 percentage points above typical levels seen in 2017 to 2019. This is a reflection of quickly selling homes and, for buyers, it means that while they can expect fresh new listings every week, they will have to be prepared to move quickly on desirable homes.”

As for newly built homes, builders are also confident about what’s ahead for housing inventory. Robert Dietz, Chief Economist at the National Association of Home Builders (NAHB), shares:

Builder confidence in the market remains strong due to a lack of resale inventory, low mortgage interest rates, and a growing demographic of prospective home buyers.”

Things are starting to look up for residential real estate inventory. As the country continues to reopen, more houses are likely to be listed for sale. However, as long as buyer demand remains high, it will take time for the balance between supply and demand to truly neutralize.

Bottom Line

Although it may be challenging to find a house to buy in today’s market, there is hope on the horizon. Let’s connect to talk about your home search so we can find your dream home this summer.

Have Your Day in the Sun by Moving Up This Summer [INFOGRAPHIC]

Have Your Day in the Sun by Moving Up This Summer [INFOGRAPHIC] | MyKCM

Some Highlights

  • Longer days and sunny weather mean summer is upon us, and what better conditions than right now to upgrade to the home of your dreams?
  • If your needs have changed, it’s a great time to upgrade – there’s likely high demand for your current house, and today’s low mortgage rates can help you afford your dream home.
  • If you’re ready to upgrade to a home that matches your changing needs, let’s connect today.

Why This Is Not Like 2008 Again

Why This Is Not Like 2008 Again | MyKCM

During the Great Recession, just over a decade ago, the financial systems the world depended on started to collapse. It created a panic that drove some large companies out of business (ex. Lehman Brothers) and many more into bankruptcy.

The financial crisis that accompanied the current pandemic caused hardship to certain industries and hurt many small businesses. However, it hasn’t rattled the world economy. It seems that a year later, things are slowly getting back to normal for many companies.

Why is there a drastic difference between 2008 and now?

In a post from RealtyTrac, they explain:

“We changed the rules. We told banks they needed more reserves and that they could no longer underwrite toxic mortgages. It turns out that regulation — properly done — can help us navigate financial minefields.”

Why This Is Not Like 2008 Again | MyKCM

Here are the results of that regulation, captured in a graph depicting the number of failed banks since 2007.

What was different this time?

The post mentioned above explains:

“In 2008 the government saw the foreclosure meltdown as a top-down problem and set aside $700 billion for banks under the Troubled Asset Relief Program (TARP). Not all of the $700 billion was used, but the important point is that the government did not act with equal fervor to help flailing homeowners, millions of whom lost their homes to foreclosures and short sales.

This time around the government forcefully moved to help ordinary citizens. Working from the bottom-up, an estimated $5.3 trillion went to the public in 2020 through such mechanisms as the Paycheck Protection Program (PPP), expanded unemployment benefits, tax incentives, and help for local governments. So far this year we have the $1.9 billion American Rescue Plan with millions of $1,400 checks as well as proposals to spend trillions more on infrastructure…Bank deposits increased by nearly $2 trillion during the past year and credit card debt fell.”

Bottom Line

Many have suffered over the past year. However, the economic toll of the current recession was nowhere near the scope of the Great Recession, and it won’t result in a housing crisis.

Home Price Appreciation Is as Simple as Supply and Demand

Home Price Appreciation Is as Simple as Supply and Demand | MyKCM

Home price appreciation continues to accelerate. Today, prices are driven by the simple concept of supply and demand. Pricing of any item is determined by how many items are available compared to how many people want to buy that item. As a result, the strong year-over-year home price appreciation is simple to explain. The demand for housing is up while the supply of homes for sale hovers at historic lows.

Let’s use three maps to show how this theory continues to affect the residential real estate market.

Home Price Appreciation Is as Simple as Supply and Demand | MyKCM

Map #1 – State-by-state price appreciation reported by the Federal Housing Finance Agency (FHFA) for the first quarter of 2021 compared to the first quarter of 2020:As the map shows, certain states (colored in red) have appreciated well above the national average of 12.6%.

Home Price Appreciation Is as Simple as Supply and Demand | MyKCM

Map #2 – The change in state-by-state inventory levels year-over-year reported by realtor.com:Comparing the two maps shows a correlation between change in listing inventory and price appreciation in many states. The best examples are Idaho, Utah, and Arizona. Though the correlation is not as easy to see in every state, the overall picture is one of causation.

The reason prices continue to accelerate is that housing inventory is still at all-time lows while demand remains high. However, this may be changing.

Is there relief around the corner?

The report by realtor.com also shows the monthly change in inventory for each state.

Home Price Appreciation Is as Simple as Supply and Demand | MyKCM

Map #3 – State-by-state changes in inventory levels month-over-month reported by realtor.com:As the map indicates, 39 of the 50 states (plus the District of Columbia) saw increases in inventory over the last month. This may be evidence that homeowners who have been afraid to let buyers in their homes during the pandemic are now putting their houses on the market.

We’ll know for certain as we move through the rest of the year.

Bottom Line

Some are concerned by the rapid price appreciation we’ve experienced over the last year. The maps above show that the increases were warranted based on great demand and limited supply. Going forward, if the number of homes for sale better aligns with demand, price appreciation will moderate to more historical levels.