August 17th Portland Metro Area (OR and WA) Market Activity for the Week of August 9th through August 15th

August 17th
Portland Metro Area (OR and WA)

Market Activity for the Week of August 9th through August 15th

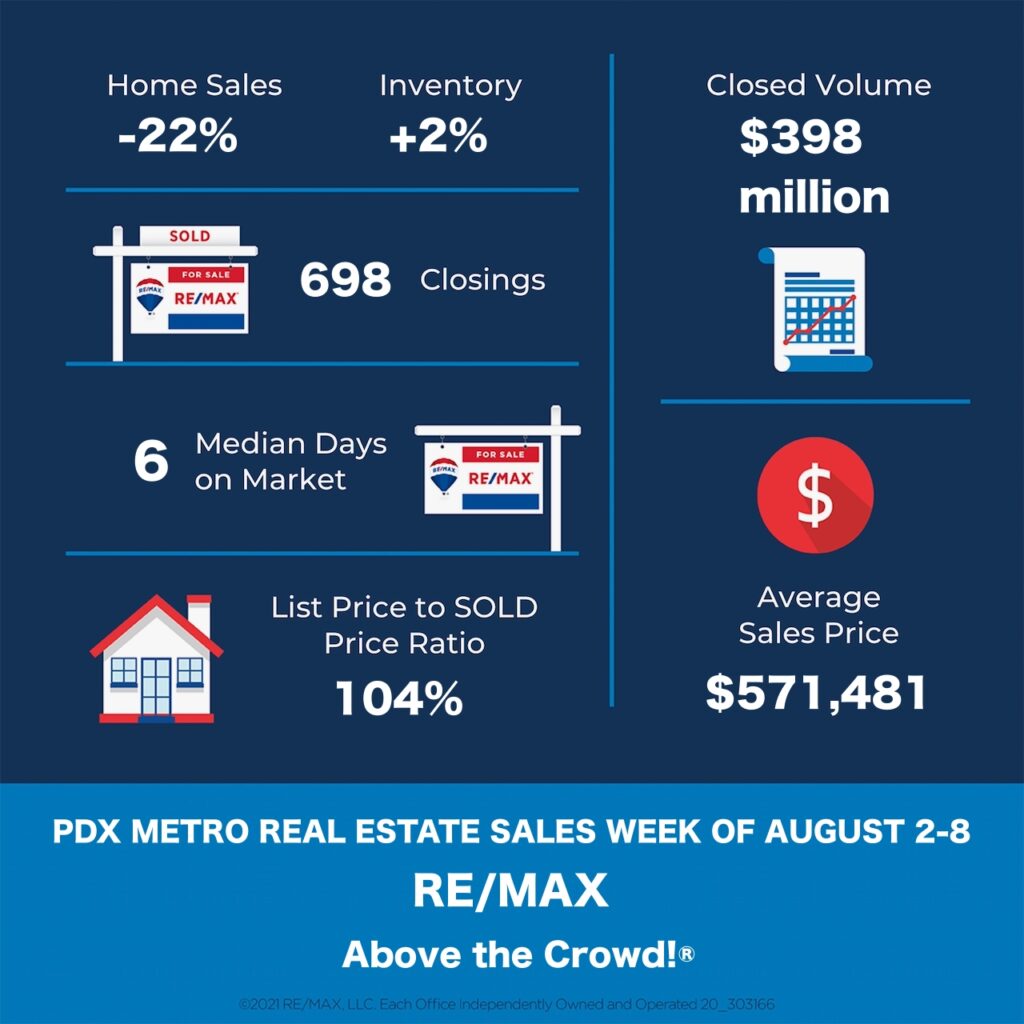
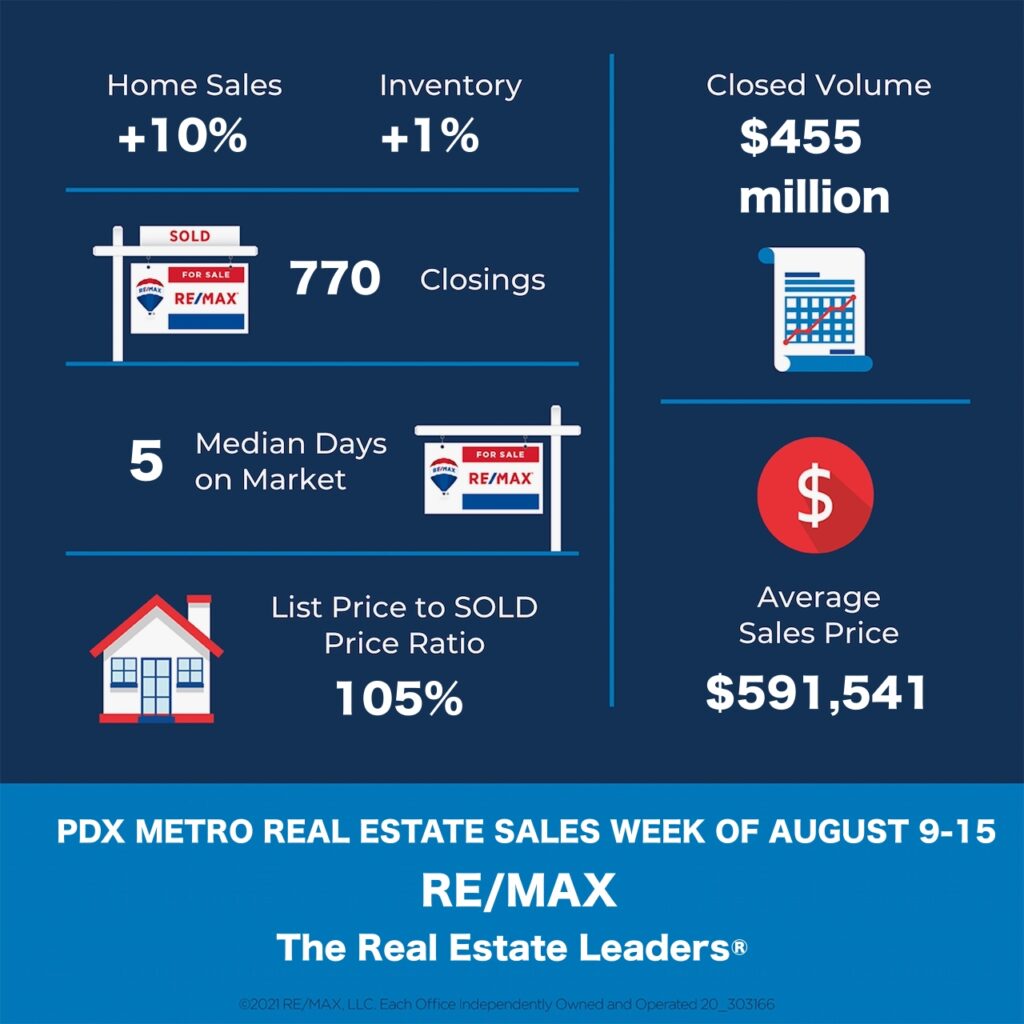
Homes Sold: 770 vs previous weeks: 698; 895; 793; 868; 732; 1035; 1035; 917; 802; 737; 685; 896; 792; 807; 749; 848; 684; 733; 687; 687; and 581. During the same week last year, this number was 897.

Active Listings: 3498 vs previous weeks: 3487; 3427; 3446; 3278; 3209; 3425; 3091; 2967; 2822; 2744; 2568; 2593; 2476; 2289; 2265; 2173; 2275 2252; 2163; 2135; and 1998.

Total number of Pending Deals: 6293 vs previous weeks: 6294; 6195; 6244; 6256; 6250; 6186; 6586; 6593; 6664; 6546; 6587; 6640; 6561; 6501; 6388; 6393; 6216; 6049; 5894; 5835 and 5779.

New Active Listings: 714

New Pending Deals: 1046 vs previous weeks: 1002; 1074; 1049; 1101; 836; 934; 1030; 1050; 1068; 904; 1084; 1117; 1079; 998; 1037; 1088; 952; and 894.

Average Days on Market 17 (31 last year)
Median Days on Market 5 (7 last year).

Average Sale price: $591,541 vs $526,794 during the same week last year.

Total Sales Volume: $455,486,570 vs $472,534,218 during the same week last year.

Average List Price vs Sale Price
Average Sale Price as a Percentage of the Asking Price  – 102.67%
Median Sale Price as a Percentage of the Asking Price – 105%
Average Sale Price as a Percentage of the Original Asking Price – 102.06%

With Rents on the Rise – Is Now the Time To Buy?

With Rents on the Rise – Is Now the Time To Buy? | MyKCM

According to recent data from realtor.com, median rental prices have reached their highest point ever recorded in many areas across the country. The report found rents rose by 8.1% from the same time last year. As it notes:

Beyond simply recovering to pre-pandemic levels, rents across the country are surging. Typically, rents fluctuate less than 1% from month to month. In May and June, rents increased by 3.0% and 3.2% from each month to the next.”

If you’re a renter concerned about rising prices, now may be the time to consider purchasing a home.

Monthly Rents Are Higher Than Monthly Mortgage Payments

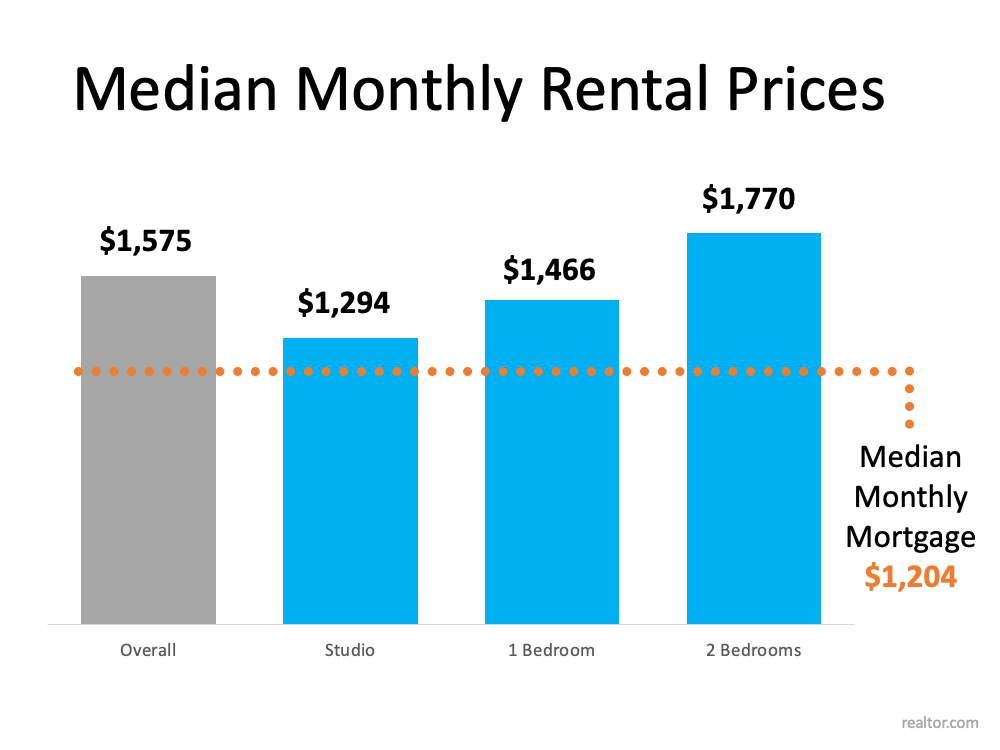
When you weigh your options of whether to buy a home or continue renting, how much you’ll pay each month is likely top of mind. According to the National Association of Realtors (NAR), monthly mortgage payments are rising, but they’re still significantly lower than the typical rental payment. NAR indicates the latest data on homes closed shows the median monthly mortgage payment is $1,204.

With Rents on the Rise – Is Now the Time To Buy? | MyKCM

By contrast, the median national rent is $1,575 according to the most current data provided by realtor.comIn other words, buyers who recently purchased a home locked in a monthly payment that is, on average, $371 lower than what renters pay today (see graph below):

Rents Are Rising Sharply, and They Continue To Increase

With Rents on the Rise – Is Now the Time To Buy? | MyKCM

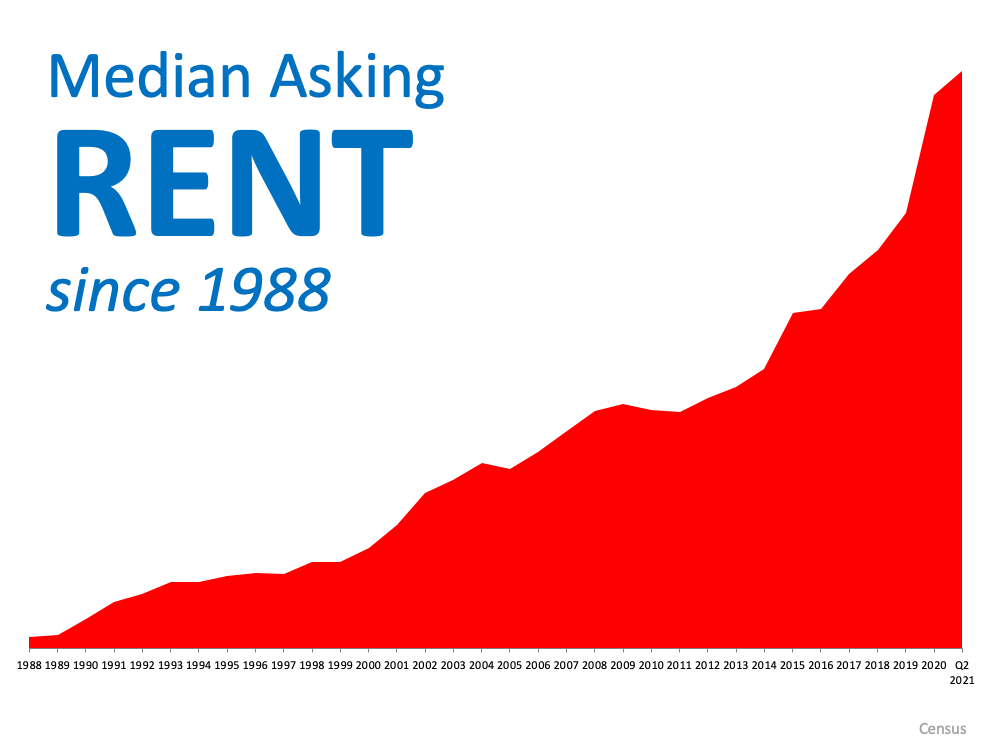
The difference in monthly housing costs when comparing renting and homebuying today is significant, but many would-be homebuyers wonder about the future of rental prices. If we look to historical Census data as a reference, the median asking rent has risen consistently since 1988 (see graph below):The rise in rent over time clearly shows one of the major advantages homeownership has over renting: stable housing costs. Renters face increasing costs every year. When you purchase your home, your mortgage rate is locked in for 30 years, meaning your monthly payment stays the same over time. That gives you welcome peace of mind and predictability for many years ahead.

Bottom Line

With rents continuing to rise across the country, renters should consider if now is the right time to buy. There are multiple benefits to buying sooner rather than later. Let’s discuss your options so you can make your most powerful decision.

Key Questions To Ask Yourself Before Buying a Home

Key Questions To Ask Yourself Before Buying a Home | MyKCM

Sometimes it can feel like everyone has advice when it comes to buying a home. While your friends and loved ones may have your best interests in mind, they may also be missing crucial information about today’s housing market that you need to make your best decision.

Before you decide whether you’re ready to buy a home, you should know how to answer these three questions.

1. What’s Going on with Home Prices?

Home prices are one factor that directly impacts how much it will cost to buy a home and how much you stand to gain as a homeowner when prices appreciate.

Key Questions To Ask Yourself Before Buying a Home | MyKCM

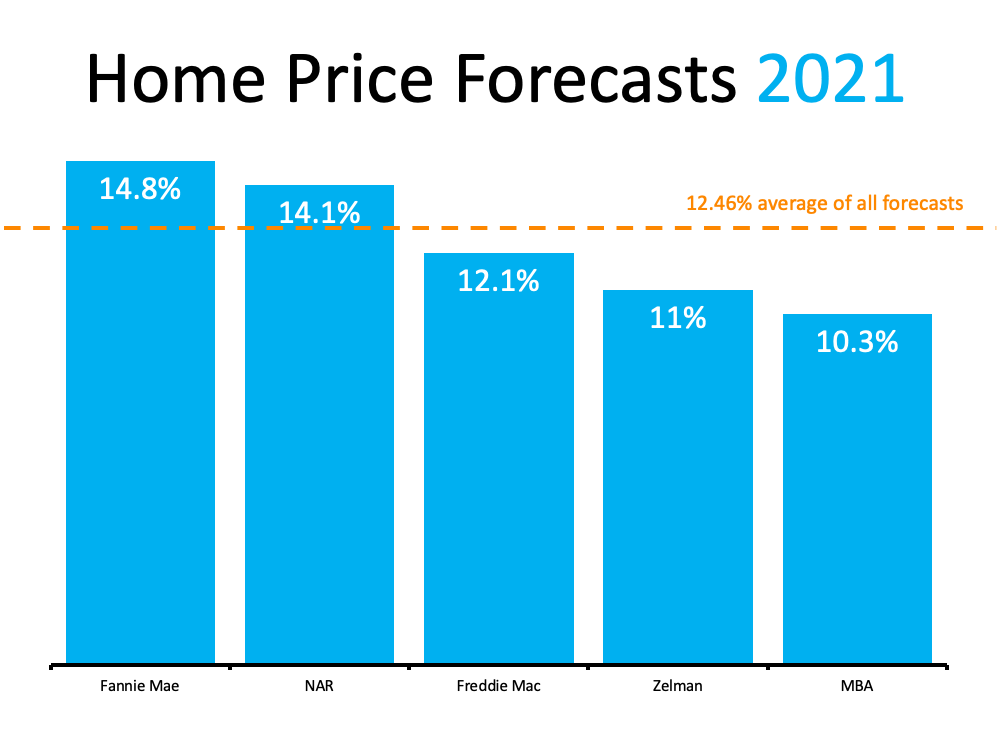
The graph below shows just how much experts are forecasting prices to rise this year:Continued price appreciation is great news for existing homeowners but can pose a significant challenge if you wait to buyUsing these forecasts, you can determine just how much waiting could cost you. If prices increase based on the average of all forecasts (12.46%), a median-priced home that cost $350,000 in January of 2021 will cost an additional $43,610 by the end of the year. What does this mean for you? Put simply, with home prices increasing, the longer you wait, the more it could cost you.

2. Are Today’s Low Mortgage Rates Going To Last?

Key Questions To Ask Yourself Before Buying a Home | MyKCM

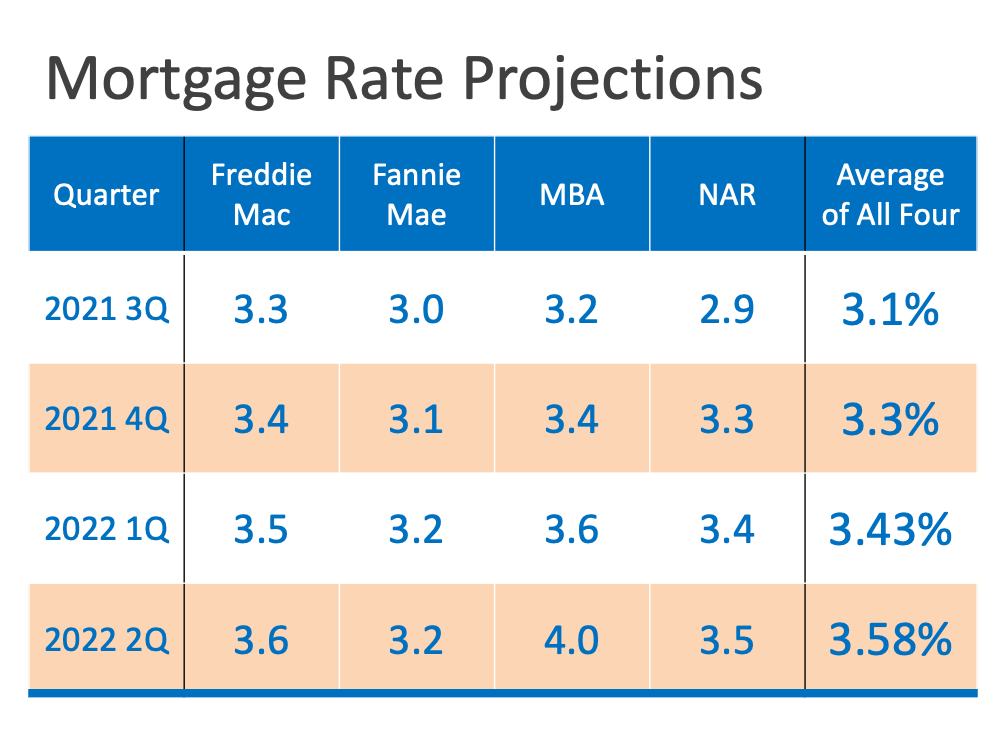
Another significant factor that should inform your decision is mortgage interest rates. Today’s average rates remain close to record-lows. Much like prices, though, experts forecast rates will rise over the coming months, as the chart below shows:Your monthly mortgage payment can be significantly impacted by even the slightest increase in mortgage rates, which makes the overall cost of the home greater over time when you wait.

3. Why Is Homeownership Important to You?

The final question is a personal one. Before deciding, you’ll need to understand your motivation to buy a home and why homeownership is an important goal for you. The financial benefits of owning a home are often easier to account for than the many emotional ones.

The 2021 National Homeownership Market Survey shows that six of the nine reasons Americans value homeownership are because of how it impacts them on a personal, aspirational level. The survey says homeownership provides:

  • Stability
  • Safety
  • A Sense of Accomplishment
  • A Life Milestone
  • A Stake in the Community
  • Personal Pride
Key Questions To Ask Yourself Before Buying a Home | MyKCM

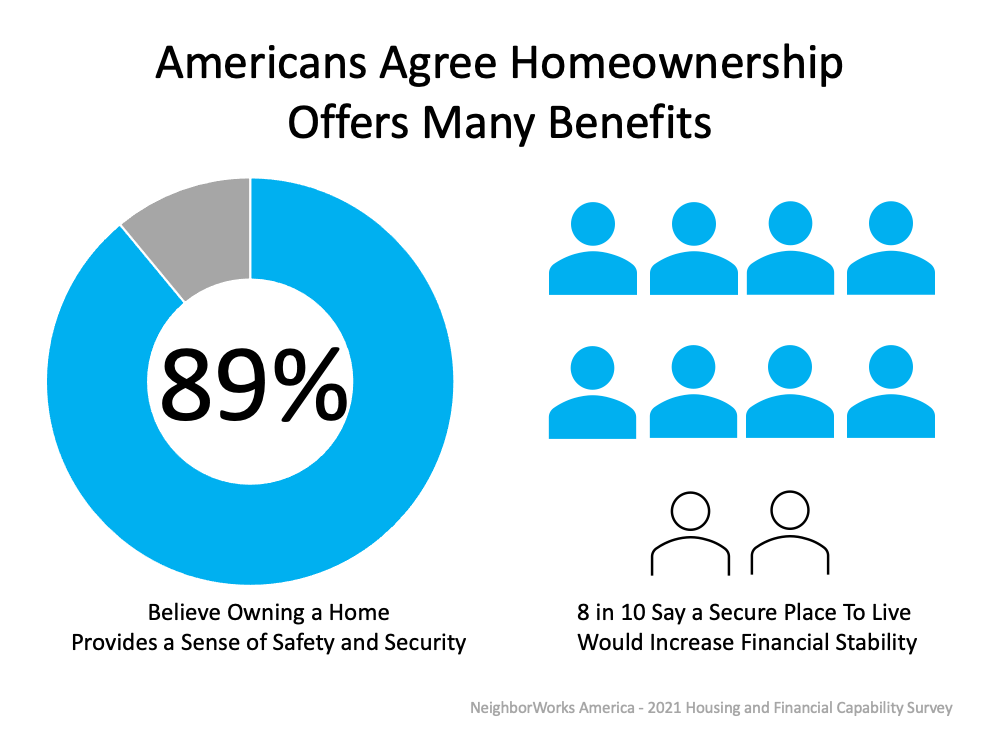
The National Housing & Financial Capability Survey from NeighborWorks America also highlights the emotional benefits of homeownership:Clearly, there’s a value to homeownership beyond the many great financial opportunities it provides. It gives homeowners a sense of pride, safety, security, and accomplishment – which impacts their lives and how they feel daily.

Bottom Line

Homeownership is life-changing, and buying a home can positively impact you in so many ways. With any decision this big, it helps to have a trusted advisor by your side each step of the way. If you’re ready to begin your journey toward homeownership, let’s connect to discuss your options and begin your journey.

Mortgage rates rise for first time in a over a month — as key economic reports shift the market’s outlook

Last Updated: Aug. 14, 2021 at 2:46 p.m. ETFirst Published: Aug. 12, 2021 at 10:08 a.m. ET By Jacob Passy
Mortgage rates rise for first time in a over a month — as key economic reports shift the market’s outlook – MarketWatch

Home buyers don’t need to fret just yet about rising rates eating into housing affordability, economists say

Mortgage rates surged higher in the wake of July’s strong jobs report as the market begins to price in a change in stance at the Federal Reserve.

The 30-year fixed-rate mortgage averaged 2.87% for the week ending Aug. 11, up 10 basis points from the previous week, Freddie Mac FMCC, -2.55% reported Thursday. It’s the first time in six weeks that the 30-year loan rose on a weekly basis.

The 15-year fixed-rate mortgage increased five basis points to an average of 2.15%, while the 5-year Treasury-indexed hybrid adjustable-rate mortgage ticked up by four basis point to an average of 2.44%.

Mortgage rates rose higher in tandem with rising bond yields, including an increase in the yield on the 10-year Treasury note TMUBMUSD10Y, 1.275%.

“After touching their lowest point in six months, mortgage rates rose over the last seven days as some key economic reports shifted the market’s outlook,” Zillow Z, -0.02% ZG, 0.38% senior economist Matthew Speakman said, adding that the July jobs data released last Friday was the primary impetus for this week’s increase in mortgage rates. Other data also indicated there were a record number of job openings as of June.

Economists see the positive developments in the labor market, as well as additional indications of rising inflation, as a prelude to the Federal Reserve shifting its stance.

“The Fed has said for months that they will not consider tightening monetary policy until more meaningful progress is achieved in the labor market,” Speakman said. “Indeed, many Fed officials have stated that they view a slowdown in their program of asset purchases to likely be sometime this fall, and the strong jobs figures are giving those statements more weight.”

On the home-buying front, while rates may be higher, they are still low from a historical perspective. “Low rates are fueling strong activity into the late-summer season, which historically has seen a slowdown,” said George Ratiu, senior economist at Realtor.com.

Rising rates won’t necessarily immediately lead to higher costs for home buyers, either. Recent data from Realtor.com shows that the number of new listings of homes for sale continues to grow, which should reduce some of the competition and price pressure buyers were facing due to the inventory shortage playing out nationwide.

(Realtor.com is operated by News Corp NWSA, -3.61% subsidiary Move Inc., and MarketWatch is a unit of Dow Jones, which is also a News Corp subsidiary.)

“These factors also signal that fall may turn out to be a busier season than usual, as buyers seek to take advantage of improving market conditions,” Ratiu said.

94% of Metro Areas Saw Double-Digit Price Growth in Second Quarter of 2021

August 12, 2021Media Contact: Quintin Simmons 202-383-1178
94% of Metro Areas Saw Double-Digit Price Growth in Second Quarter of 2021 (nar.realtor)

Key Highlights

  • The median sales price of single-family existing homes rose in 99% of measured metro areas in the second quarter of 2021 compared to one year ago, with double-digit price gains in 94% of markets.
  • The median sales price of single-family existing homes rose 22.9% to $357,900, an increase of $66,800 from one year ago. Over a 3-year period, 46 markets had price gains of over $100,000.
  • The monthly mortgage payment on a typical existing single-family home rose to $1,215 and the income a family typically needed to afford an existing single-family home increased to $58,314.

WASHINGTON (August 12, 2021) – Continued low levels of housing inventory, combined with record-low mortgage rates spurring housing demand, have caused an increase in median sales prices for existing single-family homes in all but one of 183 measured markets during the second quarter of 2021. That is according to the National Association of Realtors®’ latest quarterly report, which reveals that 94% of 183 metro areas also experienced double-digit price increases (89% in the first quarter of 2021).1

The median sales price of single-family existing homes rose 22.9% to $357,900, an increase of $66,800 from one year ago. All regions saw double-digit year-over-year price growth, which was led by the Northeast (21.8%), followed by the South (21.0%), West (20.9%), and Midwest (17.1%).

“Home price gains and the accompanying housing wealth accumulation have been spectacular over the past year, but are unlikely to be repeated in 2022,” said Lawrence Yun, NAR chief economist.

“There are signs of more supply reaching the market and some tapering of demand,” he continued. “The housing market looks to move from ‘super-hot’ to ‘warm’ with markedly slower price gains.”

That said, 12 metro areas did report price gains of over 30% from one year ago, eight of which are in the South and West regions, including Pittsfield, Mass. (46.5%); Austin-Round Rock, Texas (45.1%); Naples-Immokalee-Marco Island, Fla. (41.9%); Boise City-Nampa, Idaho (41%); Barnstable, Mass. (37.8%); Boulder, Colo. (37.7%); Bridgeport-Stamford-Norwalk, Conn. (37.1%); Cape Coral-Fort Myers, Fla. (35.6%); Tucson, Ariz. (32.6%); New York-Jersey City-White Plains, N.Y.-N.J. (32.5%); San Francisco-Oakland-Hayward, Calif. (31.9%); and Punta Gorda, Fla. (30.8%).

Yun notes that home prices are increasing sharply in the San Francisco and New York metro areas.

Over the past three years, the typical price gain on an existing single-family home totaled $89,900, with price gains in all 182 markets.2 In 46 out of 182 markets, homeowners typically experienced price gains of over $100,000. The largest price gains were in San Francisco-Oakland-Hayward, Calif. ($315,000); San Jose-Sunnyvale-Sta. Clara, Calif. ($294,000); Anaheim-Sta. Ana Irvine, Calif. ($279,500); Barnstable, Mass. ($220,600); and Boise-City-Nampa, Idaho ($206,300).

With home prices rising, the monthly mortgage payment on an existing single-family home financed with a 30-year fixed-rate loan and 20% down payment rose to $1,215. This is an increase of $196 from one year ago. The monthly mortgage payment grew even as the effective 30-year fixed mortgage rate3 decreased to 3.05% (3.29% one year ago). Among all homebuyers, the monthly mortgage payment as a share of the median family income rose to 16.5% in the second quarter of 2021 (14.0% one year ago).

“Housing affordability for first-time buyers is weakening,” Yun explained. “Unfortunately, the benefits of historically-low interest rates are overwhelmed by home prices rising too fast, thereby requiring a higher income in order to become a homeowner.”

Among first-time buyers, the mortgage payment on a 10% down payment loan jumped to 25% of income (21.2% one year ago). A mortgage is affordable if the payment amounts to no more than 25% of the family’s income.4

In 17 metro areas, a family needed more than $100,000 to affordably pay a 10% down payment mortgage (14 metro areas in 2021 Q1. These metro areas are in California (San Jose-Sunnyvale-Sta. Clara, San Francisco-Oakland-Hayward, Anaheim-Sta. Ana-Irvine, San Diego-Carlsbad, Los Angeles-Long Beach-Glendale), Hawaii (Urban Honolulu), Colorado (Boulder, Denver-Aurora), Washington (Seattle-Tacoma-Bellevue), Florida (Naples-Immokalee-Marco Island), Connecticut (Bridgeport-Stamford-Norwalk), New York (Nassau, New York-Newark-Jersey City), Massachusetts (Boston, Barnstable), District of Columbia-Virginia-Maryland-West Virginia (Washington-Arlington-Alexandria), and Oregon-Washington (Portland-Vancouver-Hillsboro).

There were only 84 metro area markets in which a family needed less than $50,000 to afford a home, down from 104 markets in 2021 Q1. The most affordable markets – where a family can typically afford to buy a home financed with a 10% down payment with an income of $25,000 or less – are in the Rust Belt areas of Youngstown-Warren Boardman, Ohio ($24,401); Peoria, Illinois ($24,013); Cumberland, Maryland ($23,773); and Decatur, Illinois ($21,481).

“Housing supply will be critical in moderating the growing housing costs and rising rents,” Yun said. “Any disincentive to produce more housing inventory, such as extending the eviction moratorium, will only worsen the current shortage,” Yun said.

Yun noted that NAR has requested “expeditious release” of rental subsidy funds in order to assist those who may be facing eviction.

The National Association of Realtors® is America’s largest trade association, representing more than 1.4 million members involved in all aspects of the residential and commercial real estate industries.

# # #

NOTE: NAR releases quarterly median single-family price data for approximately 183 Metropolitan Statistical Areas (MSAs). In some cases, the MSA prices may not coincide with data released by state and local Realtor® associations. Any discrepancy may be due to differences in geographic coverage, product mix, and timing. In the event of discrepancies, Realtors® are advised that for business purposes, local data from their association may be more relevant.

Data tables for MSA home prices (single-family and condo) are posted at https://www.nar.realtor/research-and-statistics/housing-statistics/metropolitan-median-area-prices-and-affordability. If insufficient data is reported for an MSA in a particular quarter, it is listed as N/A. For areas not covered in the tables, please contact the local association of Realtors®.


1 Areas are generally metropolitan statistical areas as defined by the U.S. Office of Management and Budget. NAR adheres to the OMB definitions, although in some areas an exact match is not possible from the available data. A list of counties included in MSA definitions is available at: https://www.census.gov/geographies/reference-files/time-series/demo/metro-micro/delineation-files.html(link is external).

Regional median home prices are from a separate sampling that includes rural areas and portions of some smaller metros that are not included in this report; the regional percentage changes do not necessarily parallel changes in the larger metro areas. The only valid comparisons for median prices are with the same period a year earlier due to seasonality in buying patterns. Quarter-to-quarter comparisons do not compensate for seasonal changes, especially for the timing of family buying patterns.

Median price measurement reflects the types of homes that are selling during the quarter and can be skewed at times by changes in the sales mix. For example, changes in the level of distressed sales, which are heavily discounted, can vary notably in given markets and may affect percentage comparisons. Annual price measures generally smooth out any quarterly swings.

NAR began tracking of metropolitan area median single-family home prices in 1979; the metro area condo price series dates back to 1989.

Because there is a concentration of condos in high-cost metro areas, the national median condo price often is higher than the median single-family price. In a given market area, condos typically cost less than single-family homes. As the reporting sample expands in the future, additional areas will be included in the condo price report.

The seasonally adjusted annual rate for a particular quarter represents what the total number of actual sales for a year would be if the relative sales pace for that quarter was maintained for four consecutive quarters. Total home sales include single-family, townhomes, condominiums and co-operative housing.

2 NAR does not have 2018 data for Detroit-Warren-Dearborn, Mich.

3 This is the effective mortgage rate based on Freddie Mac’s 30-year fixed contract rate mortgage, points and fees.

4 Housing costs are burdensome if they take up more than 30% of income. The 25% share of mortgage payment to income considers the idea that homeowners have additional expenses, including mortgage insurance, home insurance, taxes, and expenses for property maintenance.
Waiting To Buy a Home Could Cost You [INFOGRAPHIC]

Waiting To Buy a Home Could Cost You [INFOGRAPHIC] | MyKCM

Some Highlights

  • If you’re thinking of buying a home but wondering if waiting a few years will save you in the long run, think again.
  • The longer the wait, the more you’ll pay, especially when mortgage rates and home prices rise. Even the slightest change in the mortgage rate can have a big impact on your buying power no matter your price point.
  • Don’t assume waiting will save you money. Let’s connect to set the ball into motion today while mortgage rates are hovering near historic lows.

Home Sellers: There Is an Extra Way To Welcome Home Our Veterans

Home Sellers: There Is an Extra Way To Welcome Home Our Veterans | MyKCM

Some veterans are finding it difficult to obtain a home in today’s market. According to the National Association of Realtors (NAR):

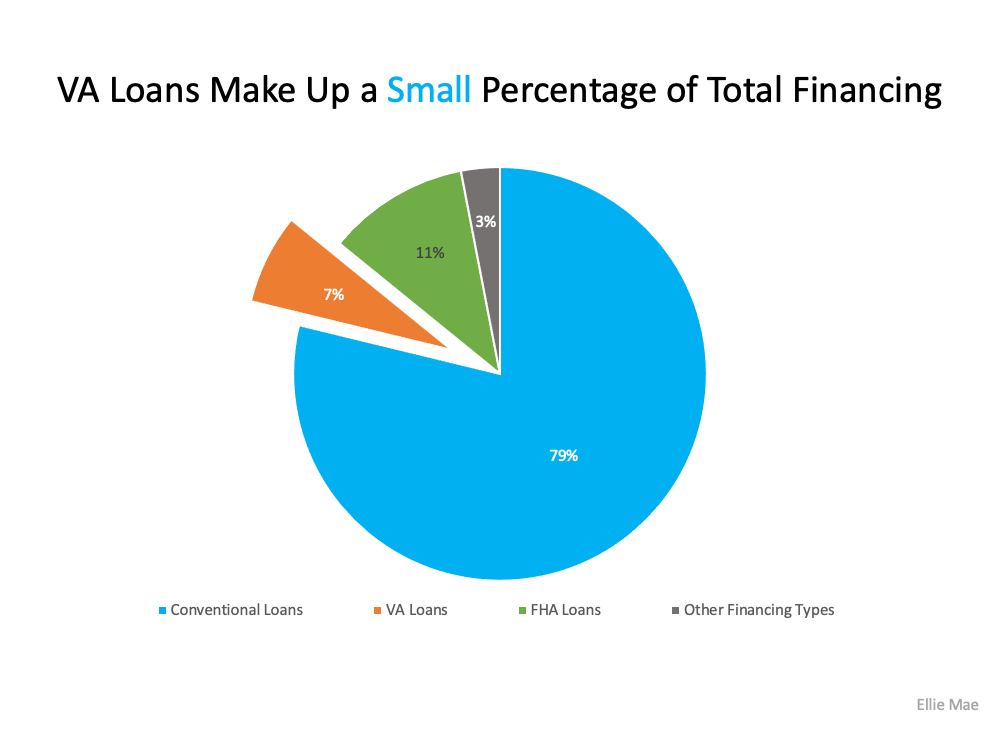
“Conventional conforming mortgages (mortgages that conform to guidelines set by Fannie Mae and Freddie Mac), accounted for 74% of mortgages obtained by homebuyers in May 2021, an increase from about 65% during 2018 through 2019…The share of VA-guaranteed loans has also decreased to 7% in May 2021 from about 10% in past years.”

Home Sellers: There Is an Extra Way To Welcome Home Our Veterans | MyKCM

Recent data in the latest Origination Insight Report from Ellie Mae sheds light on the continuation of this trend. Below, we can see just how small of a share of total financing VA loans made up in June of 2021, according to that Ellie Mae report:The drop in VA loan usage can be attributed to the difficulties veterans continue to face when buying a home. The NAR article elaborates:

“It is extremely difficult for FHA/VA buyers to get accepted in a multiple offer situation. They are on the bottom of the hierarchy.”

One contributing factor is that buyers with VA loans can’t waive certain contingencies. However, just because a certain contingency must be present for a particular buyer doesn’t mean that buyer’s offer shouldn’t be considered.

What Should Sellers Do To Help Create a Level Playing Field?

As a seller, it’s important to consider every offer in front of you regardless of loan type. If you’re selecting an offer because some contingencies are waived, keep in mind that it doesn’t always mean the offer is what’s best for you.

Buyers who can’t waive specific contingencies may adjust other terms in their offer to make it more appealing to sellers. This may depend on several factors, including their loan type and location, but a motivated buyer and their agent will do everything they can to present an offer that’s as appealing to you as possible.

Ultimately, you should make sure you take time to really understand the terms of their offer and see the big picture. Working with a driven buyer who’s motivated to purchase your house may provide a better opportunity for you to reach your overall best option and what’s most important to you.

Bottom Line

If you’re ready to sell, let’s connect. Together, we can make sure you understand the terms of all offers so you can give each one fair consideration, including those buyers using a VA loan. Our veterans sacrifice so much for our country. They’ve earned our gratitude and should have the same opportunity to obtain the home of their dreams.